ChemQuiz results

Contents
The teacher used the Excel 2010 version of Lertap 5 to find out how many students answered each question, or item, correctly.
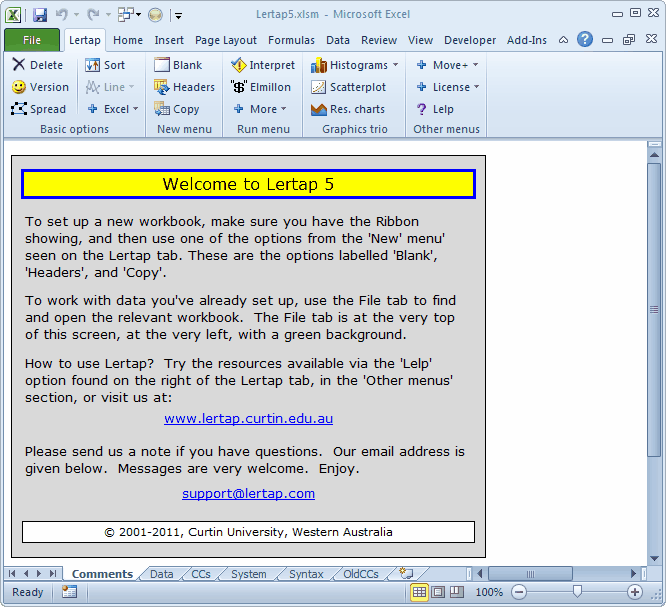
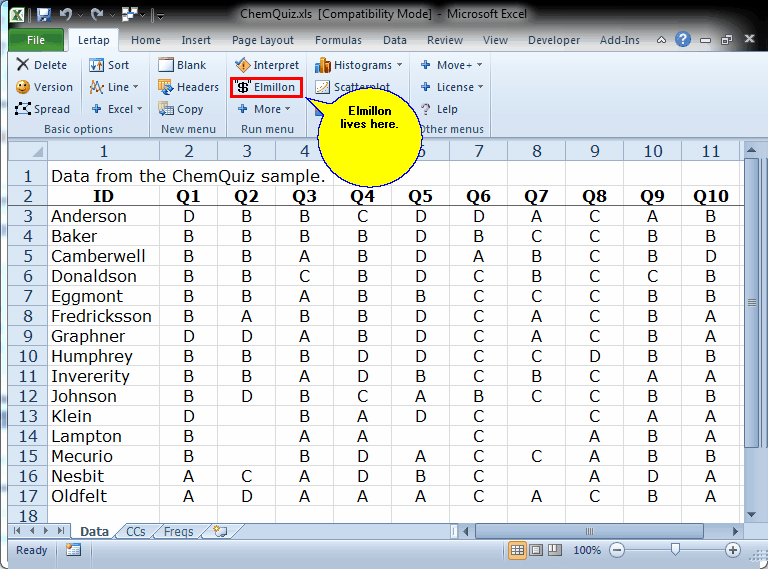
This is how Lertap 5 looked when he processed his data early in 2011:
In order to get Lertap to produce results for his quiz, the teacher has to follow three steps.
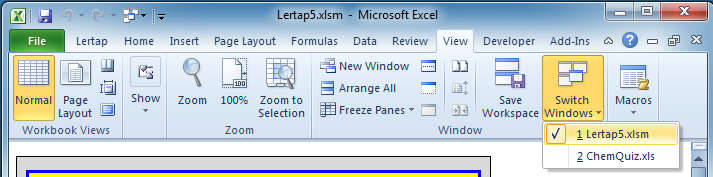
Step 1: switch the view to his workbook.
The name of the teacher's Excel workbook was "ChemQuiz.xls". The workbook in focus above is "Lertap5.xlsm"; it's the "active workbook". Before we can work with ChemQuiz.xls, we have to bring it to the fore, making it the active one. There are several ways to do this -- holding the Alt key and then pressing the Tab key is one way, and easy. In Windows Vista, each open document has a "tab" on the task bar at the bottom of the screen, and switching from one workbook to the other is done by clicking on the tabs. In Windows 7, the task bar at the bottom of the screen also has "tabs" for each running application, but the links to the documents in use by the applications are all collapsed; they reveal themselves when you hover above the tab.
Another way to switch from Lertap5.xlsm to ChemQuiz.xls is to go to the View tab, select Switch Windows, and then click on ChemQuiz1.xls.
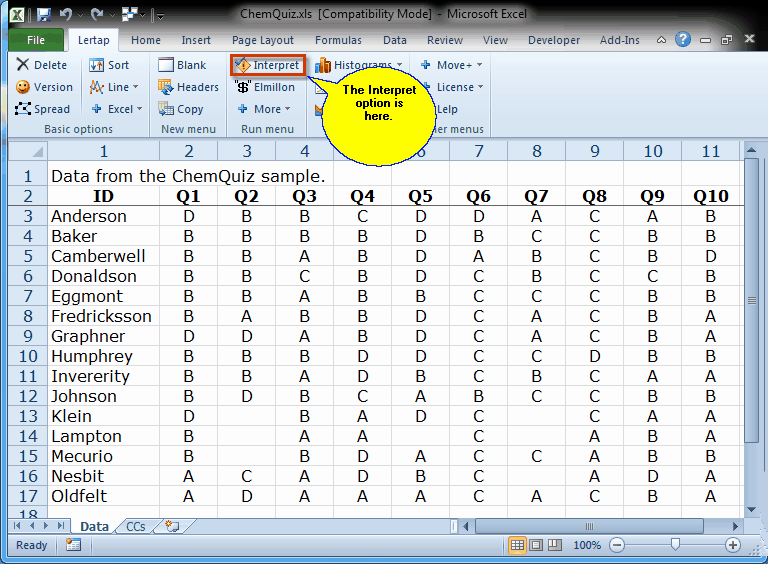
Step 2: from the Lertap tab, select Interpret in the Run menu section.
Lertap action begins with a click on the Interpret option:
The Interpret option actually does a considerable number of things. It checks to see that it can understand, or "interpret", the lines in the CCs worksheet. It sets up the crucial "Sub" worksheet for Lertap's internal usage, and then, after hiding the Sub worksheet, goes on to make a new worksheet, "Freqs", which looks like this:
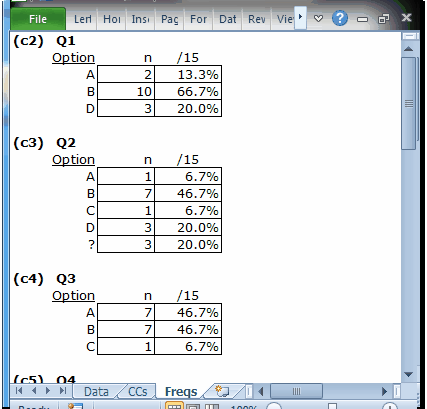
The Freqs, or frequencies, report is truly a simple one. One of its primary purposes is to provide a check on data processing. In this case, all of the items, or questions, used A, B, C, and D as possible responses. So, were we to see an E or an F in the Freqs report, we might be alarmed (more likely, perhaps, would be a lower-case a, b, c, or d, which might also alarm us).
If all items used A, B, C, and D, why is there no C for the little Q1 table? Because no student selected option C on this item -- if you scroll up to the view of the Data sheet above, you can see there's no C in c2, the column used for Q1. (We might say that this option was a no-C, eh?)
What's that little ? mark doing at the bottom of Q2's table? It's pointing out that there were three responses in c3, column 3, which were not A, B, C, or D.
Another glance back at the Data worksheet shows that c3 has three blanks, three places where students did not answer Q2. These were the students named Klien, Lampton, and Mercurio.
Having said these things, we should definitely point out that Freqs has some useful content, a message or two for us to take in. For example, Q1, whose responses are located in c2, the second column, had an option, C, which no-one chose. Later on we'll have the chance to say that, in some cases, having an option which nobody selects can be an unwanted outcome at times.
Freqs also indicates that students were "all over the place" on Q2; their responses were spread out over all of the item's four options. This may have been an item which confused the students, causing three of them to refrain from offering any answer at all.
What if Freqs did indicate an error? What if, for example, it showed this:
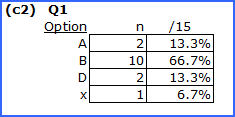
Of the 15 records of student Q1 responses in the Data worksheet, one has an "x" in the second column, c2. Highly unexpected, and unwanted. Before asking Lertap to make any more reports of results, we would want to go back, find the error, and correct it. In this case that would be easy to do as there are only 15 students. In a larger data set, with thousands of students, finding the x is something we'd ask Excel to do by, perhaps, simply using a filter on c2, or, perhaps, by searching c2 for the row which has that x. Excel has heaps of power and options, and its help system isn't too bad either.
What does our chemistry reacher know after using the Interpret option? How the students responded to each question. This may be useful information on its own, but most times it's likely that the teacher would go on to Step 3.
Step 3: from the Lertap tab, select Elmillon in the Run menu section.
"Elmillon" was the name of the first version of Lertap, developed for the Venezuelan Ministry of Education in 1971. When it was finished, and installed in the Ministry's research division, the head of the division said it was worth a million Bolivares to the division, "un millon de Bolivares", just as Americans might say "Hey!, it's worth a million bucks to us!". In English, Elmillon might be pronounced as "el me own".
Elmillon is the real engine room of Lertap.
After clicking on the Elmillon option, the teacher's screen looked something like this:
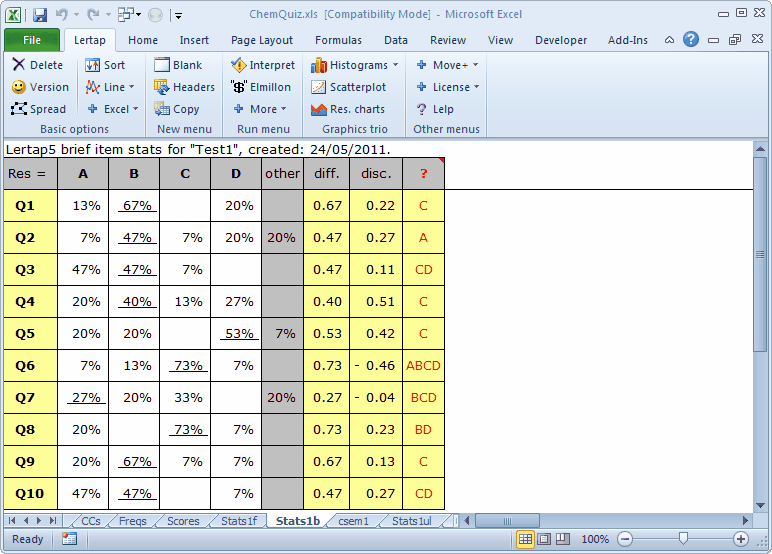
Elmillon has added five (5) new worksheets to the workbook: Scores, Stats1f, Stats1b, csem1, and Stats1ul, and has placed the focus on Stats1b.
Our chemistry teacher was not an expert on the theory of tests and measurement. He simply wanted to know how many students were able to answer each question correctly. The Stats1b report suits his needs: the columns labeled A B C D display the percentage of students who selected each option, with the correct answer, the item key, underlined. (The "other" column has an entry when some students do not answer an item.)
On several questions, more than two thirds of the class knew the right answer. These were Q1, Q6, Q8, and Q9. While this was pleasing to the teacher, he was concerned with some of the other questions. For example, he noted that only 27% got Q7 correct, an item which had to do with the rare earth elements. He made a note to review this topic with the students.
It bears repeating that the teacher in this example had a simple, practical need, one which related to feedback on his teaching, and the possible need to review topics with his class. Of Lertap's numerous reports, he used only Stats1b, and, even then, only part of it. The diff., disc., and ? columns in Stats1b went unused in this case. They refer to item difficulty, item discrimination, and to item options which may not have performed in a statistically-optimal manner; these indicators were of no interest to our teacher.
It's also for this reason that the teacher did not care to look at the other reports made by Lertap, such as Scores, Stats1f, csem1, and Stats1ul. Stats1b had all the information he needed in this case. The other reports come to the fore when test scores are of interest, a matter which leads directly into a determination of test quality. The MathsQuiz sample is our first example of how the other reports are used to look at into such issues; the M.Nursing sample gets into the case of mastery testing, and also shows how Lertap and Excel can team up to look at how item responses, and test scores, may differ among groups of test takers (such as males and females, or various geographic regions). The Negocios sample touches on how Lertap may be used to see if students may have colluded when answering test items (that is to say: cheated).
Tidbits:
Users can turn off the creation of some of Lertap's reports. The production of the Stats1ul sheet, in particular, is quite an intensive activity for Excel to engage in, taking time, memory, and temporary disc space for scratch work. If the teacher had no interest in Stats1ul, he could use the settings in Lertap's System worksheet to turn off its production.
(The Stats1ul report is extensively covered in the printed manual. An electronic version of the manual, a file called "Lertap5UserManual.pdf", may be downloaded from here.)