M.Nursing, a mastery test

Contents
A professional nursing organization contracted for the development of a master's degree course in nursing, a course subsequently licensed to universities and medical colleges for delivery. In 2009, the course was available in more than two dozen countries. All instruction is given in English (no matter the country), and all examinations are in English.
The results presented in this topic are from the administration of one of the exams, a 60-item test covering aspects of health care management. Data are from five testing venues, three in an English-speaking country, one in Asia, and one in South America. In all cases students (n=1,769) marked their answers on mark-sense scoring sheets. These were locally scanned to produce Excel-compatible files with the students' responses.
The exam has a cutoff point, or "mastery score", of 70%. Any student scoring less than 70% is placed in a conditional category, and can be required to repeat the course content covered by the exam (assignment work and class participation help to decide on whether or not students have to repeat).
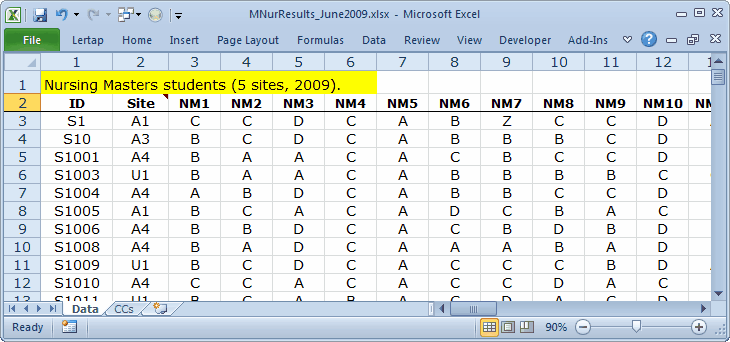
Testing venue is coded as "Site" in column 2 of the Data worksheet. Sites with a code beginning with the letter A are from the English-speaking country; H is for the Asian test venue; U for South America. The scanner recorded a Z as an item "response" whenever the student did not answer an item, or shaded in more than one bubble on the mark-sense sheet.
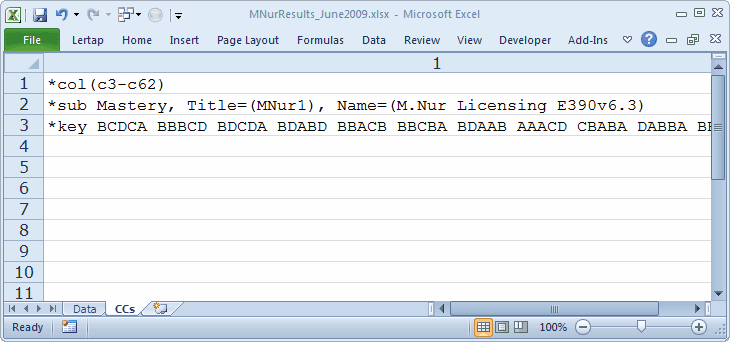
Note the presence of "Mastery" on the *sub line. This word is required in order to produce the mastery test statistics supported by Lertap. The mastery percentage level is set to 70% in the System worksheet, a value which may be changed. It is also possible to specify another level on the *sub line itself. For example, Mastery=50% would set the level at 50%. (Mastery=50, on the other hand, would set the cutoff to a test score of 50. Read more about this here.)
Ready for results? (You can play along if you've downloaded this dataset.)
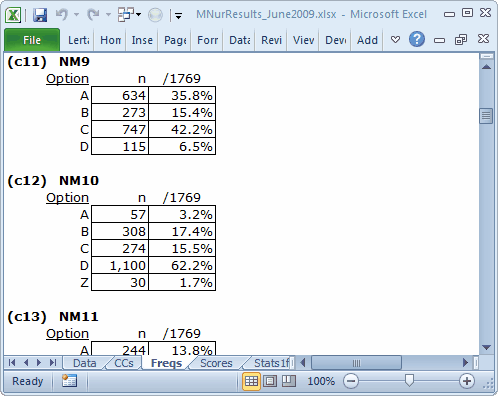
A scan of the Freqs report revealed the largest number of Zs for NM10, the item whose responses are recorded in c12 of the Data worksheet. Most items had less than 1% in their Z tally. Many had no Zs, such as NM9.
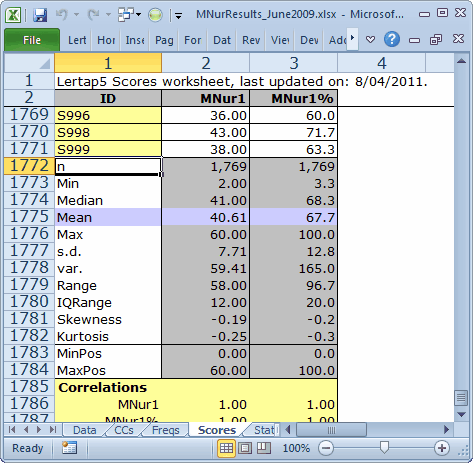
Whenever mastery mode is on in Lertap, the Scores report includes both the actual test score and its percentage equivalent.
In this case the lowest score, "Min", is just 2, or 3.3%. A histogram reveals that this is an outlier:
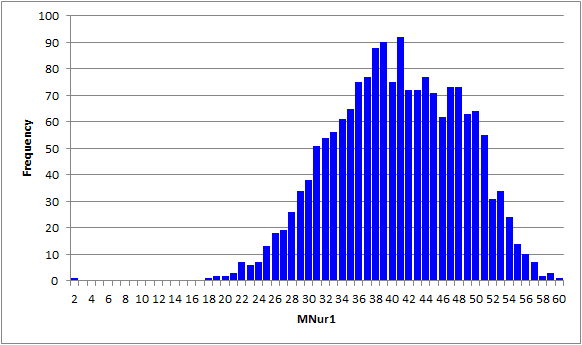
The next-lowest score, after 2, is 18. There is clearly something odd about the score of 2.
How to find out which student got a score of 2?
A quick way is to go to the Scores worksheet, then use Excel's Data tab, then click on Filter.
Click on the little arrowhead in the second column. Unclick Select All. Click 2.00.
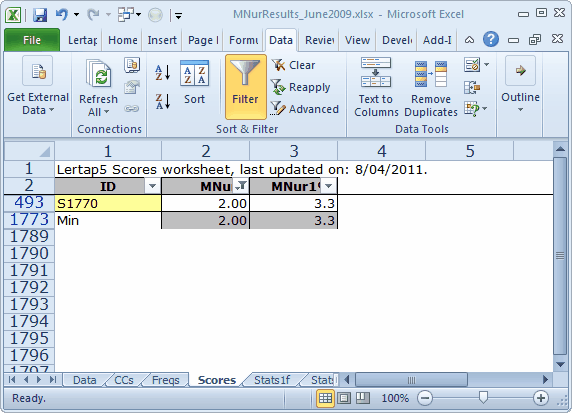
Filter will show all rows in the Scores worksheet which have a value of 2.00 in column 2. The ID of the student with this score is S1770.
To see item responses for S1770, go to the Data worksheet, and search for S1770 (use "Find", an option on the Home tab). You'll see that this student was from the South American testing site (U1), and that, after item NM12, his or her item "responses" were all Zs. This student's results are (or certainly seem to be) an anomaly. There would be much to say for deleting the student's record from the Data worksheet, and then re-running Lertap's Interpret and Elmillon options. The results seen in the topics immediately following are based on a Data worksheet with this student's results taken out.
Keep moving forward!