|
<< Click to Display Table of Contents >> Results |
  
|
|
<< Click to Display Table of Contents >> Results |
|
Were the items any good?
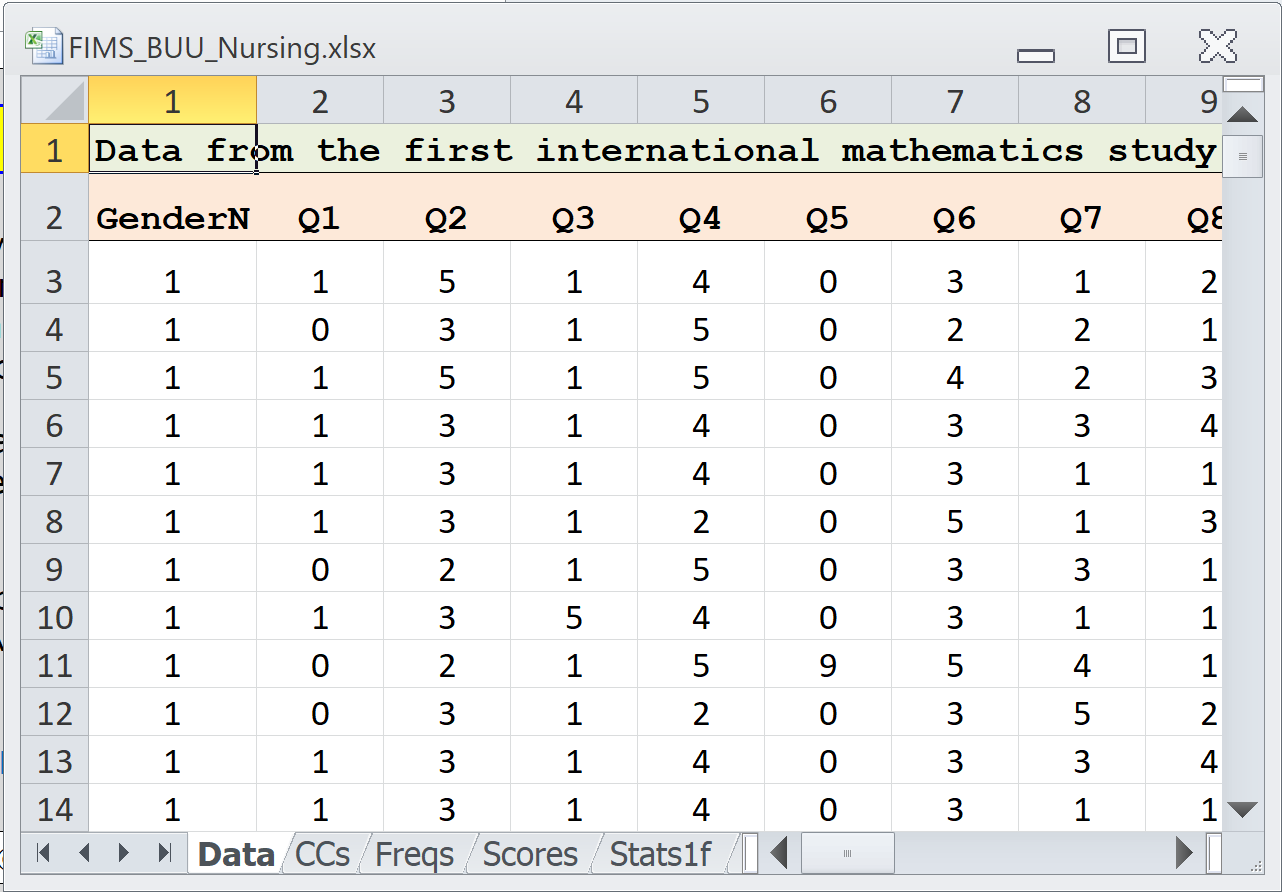
Over 6 000 students responded to one of the FIMS tests in 1970. Some were in Australia and others were in Japan.
I have their item responses in an Excel workbook. Here is a snippet:
I then ran an item analysis program called "Lertap 5" to get results. Here is a histogram of the test scores:
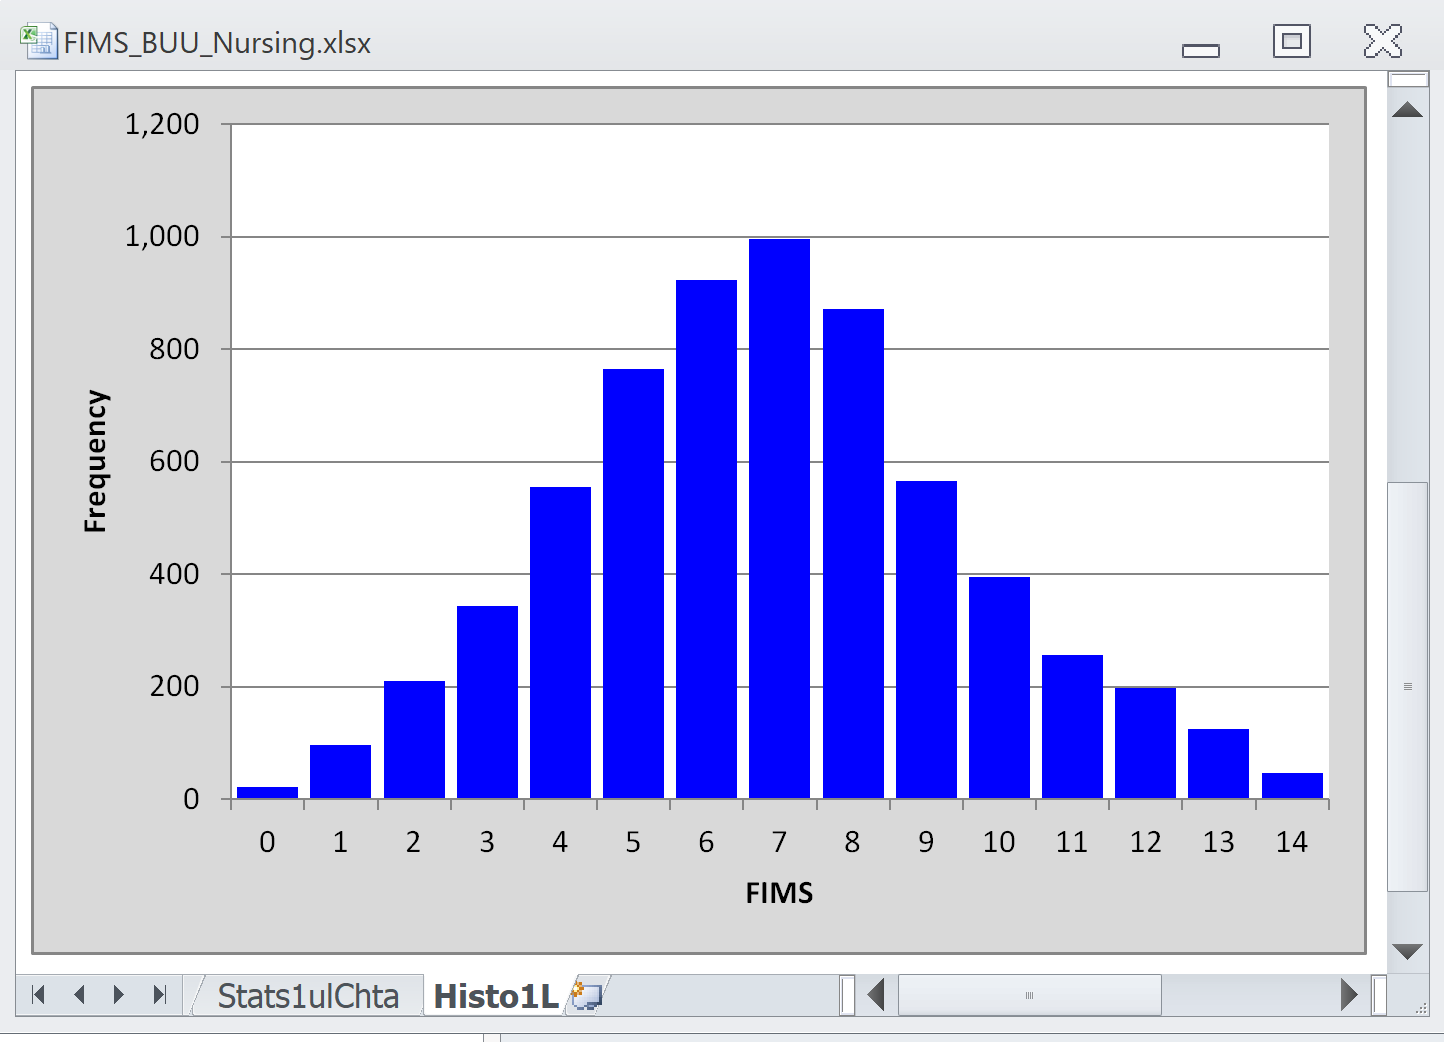
This is quite a nice graph. It's symmetrical about the median score of 7.
Looking at score histograms is quite useful. Quite often we want a test to "discriminate" among the students, by which I mean a test whose items will be good enough to allow us to identify the best students, and also the weakest. The best ones will then continue their maths studies; the weak ones will be given remedial classes to see if they can catch up. A test which is able to do this will result in a distribution of scores like the one above -- spread out with some students getting top scores but others getting low scores.
Tests which discriminate will have items with good statistics. Here are results for the items, and they're actually not all that good:
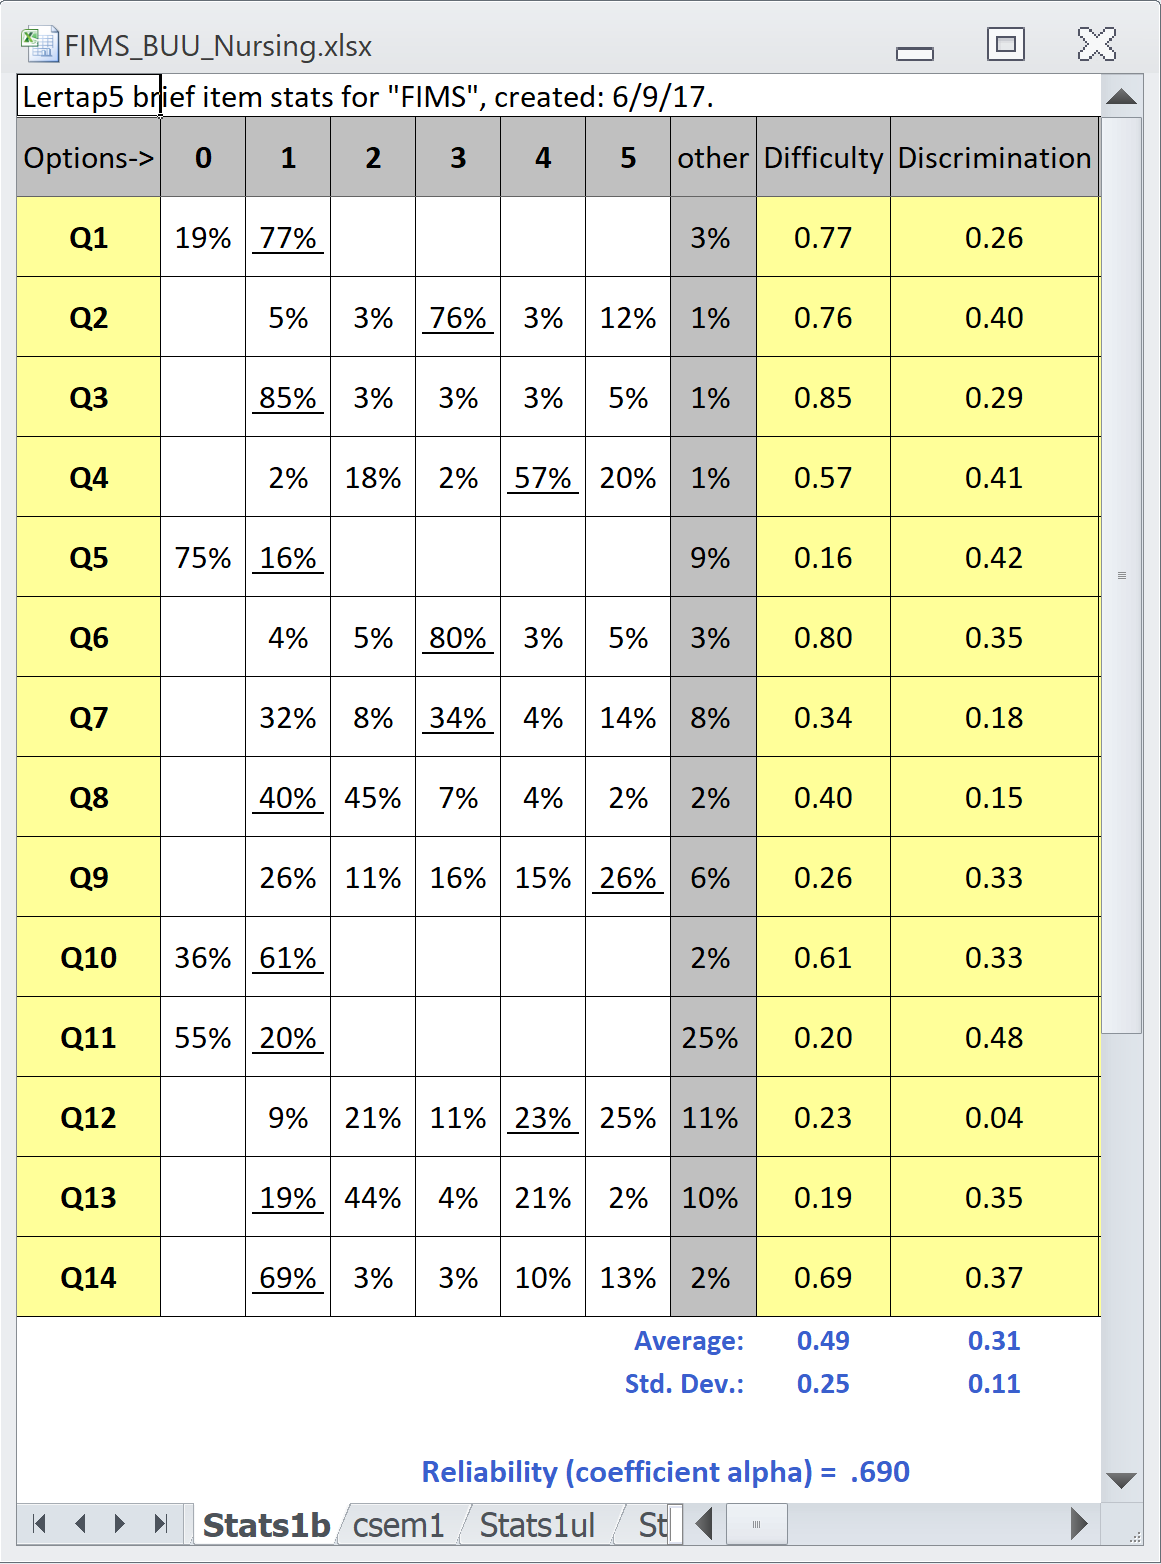
On each item, the percentage of students who got the item right is underlined. This is called the item's "Difficulty" index.
The hard items are those with Difficulty < .30, that is, items where less than 30% of the students got the right answer.
There were five hard items: Q5, Q9, Q11, Q12, and Q13.
Easy items are those with Difficulty > .70, that is, items where more than 70% of the students got the right answer.
There were four easy items: Q1, Q2, Q3, and Q6.
The item Discrimination coefficient indicates how the item "pulls the students apart". A discriminating item is one where only the best students, the strongest students, the most proficient students get the item right.
To understand item discrimination, I had Excel divide the students into three groups, Grp1, Grp2, and Grp3, based on their test score. Grp1 was the group with the top scores, above 7; Grp3 had the low scores, below 7; Grp2 was everyone else.
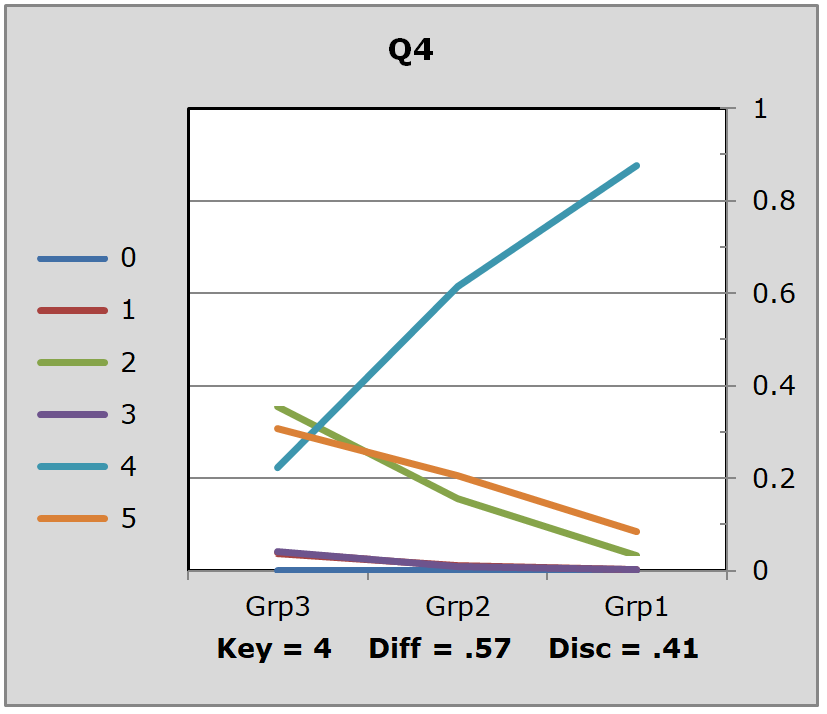
The graph above is a picture of a "discriminating item", in this case it was Q4.
The proportion of students in the top group, Grp1, who got Q4 correct was about .9, or 90% (the right answer was 4, or D on the original test, as shown in the handout). In the bottom group, Grp3, it looks like about 35% thought 2 (B on the original test) was the right answer, about 30% thought is was option 5, while about 20% of Grp3 did get the right answer, 4.
The difference between the proportion correct in Grp1 and the proportion correct in Grp3 is called the "Upper-Lower" discrimination figure. For Q4 it would be .90 - .20, or 0.70.
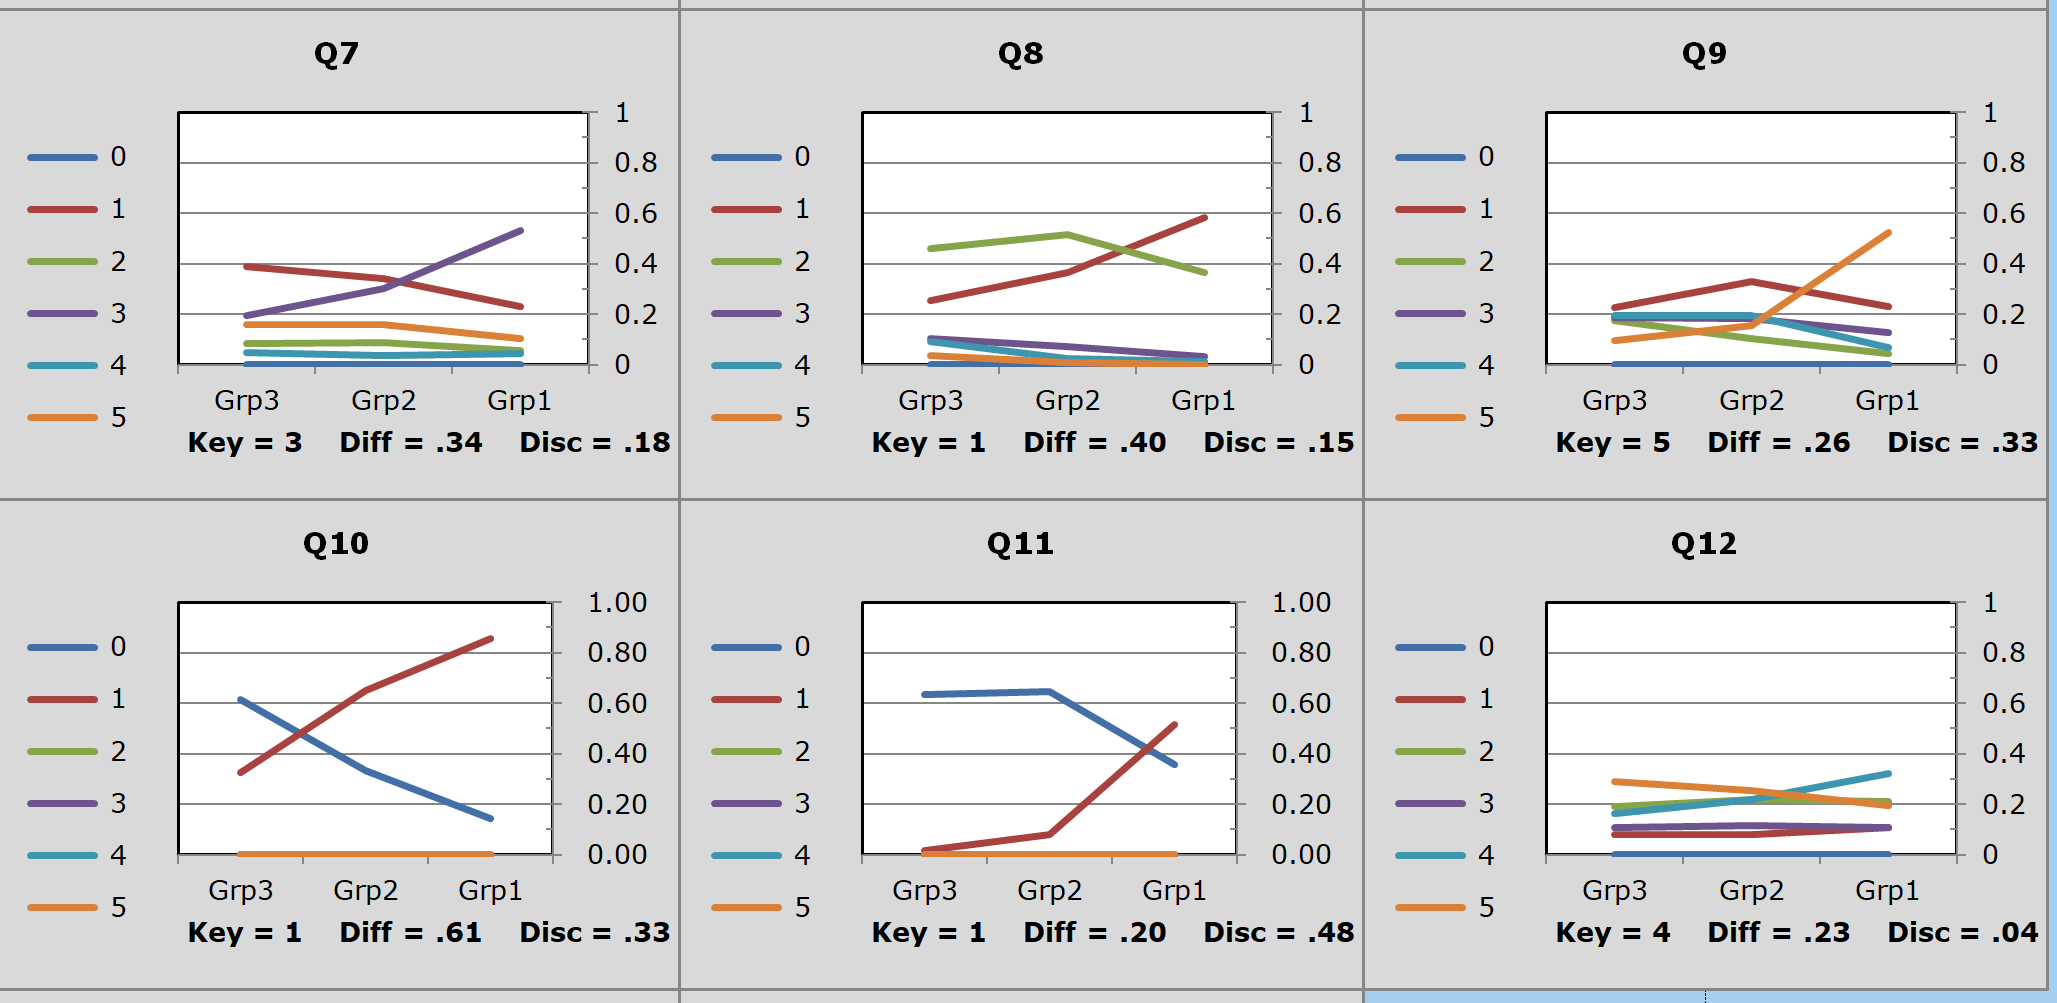
A problem with this administration of the FIMS test was that there were several items which did not discriminate. In the sample of graphs above, Q12 performed terribly -- in fact, of the six items plotted here, only one, Q10, was a reasonable discriminator.
Whenever we have items failing to discriminate, test reliability, as measured by coefficient alpha, will be low. In this case, as seen way above, it was 0.69 -- this would be regarded as low by many "psychometricians".
Whenever reliability is low, measurement error will be high. Here is a snip from another part of the report made by the item analysis program:
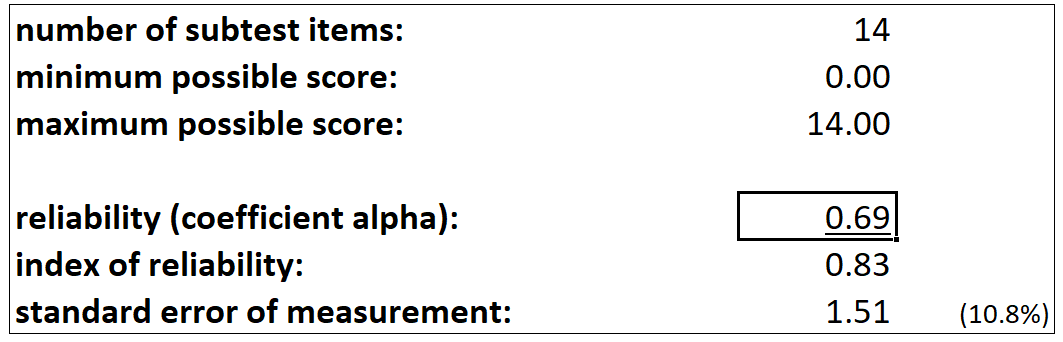
The standard error of measurement, "SEM", was found to be 1.51, or about 11%.
Take a student with a test score of 7, 50% correct. If we think of the 14 items as a random draw from the item pool, and apply the binomial theory again, a 68% confidence interval for the student's proportion correct in the pool would be .39 to .51, or 39% to 61%.
A 95% confidence interval would be .28 to .72, or 28% to 72%.
These confidence intervals are very wide. They would become narrower if we used more test items. We could use what's called the "Spearman-Brown Prophecy Formula" to calculate what the test reliability would likely be if we had 30 items instead of 14: it would go up to 0.83, bringing the SEM down to about 8%. Now the 95% confidence interval for a student with a score of 50%, would be .34 to .66, or 34% to 66%.
This is still very wide. Besides using more items, we could also use better items if we could find them. Reliability, as measured by coefficient alpha, is highly related to item discrimination values. As we've now seen, the 14-item FIMS test had several items with low discrimination values. These items served to bring coefficient alpha down.
---
Note: there may be a few viewers who will know that I shouldn't really use SEM here as it's an approximation; it's not based on the binomial. My item analysis has another report based on true binomial values; for a score of 7 the conditional SEM, CSEM, was 11.8%.