|
<< Click to Display Table of Contents >> Getting going |
  
|
|
<< Click to Display Table of Contents >> Getting going |
|
I particularly want to address the Faculty of Nursing students who are here today.
I will assume that students may not have much background in statistics, and, as best I can, I'll try to simplify the statistics that I will use today, trying not to get bogged down in the equations which are behind the statistics.
You will see that there are two handouts for today.
One is a test of mathematics with 14 items (questions).
The other is a survey used with high school principals. It has 10 items (questions).
There are two quite important statistical "concepts" that I we need to look at before doing anything else.
One concerns score distributions, while the other has to do with something called "correlation".
When it comes to score distributions, we need to have an idea of what the "mean" and "standard deviation" are.
Look at the following histogram. It displays the scores of 4,320 Australian students who answered the 14-item maths test quite a long time ago (1970):
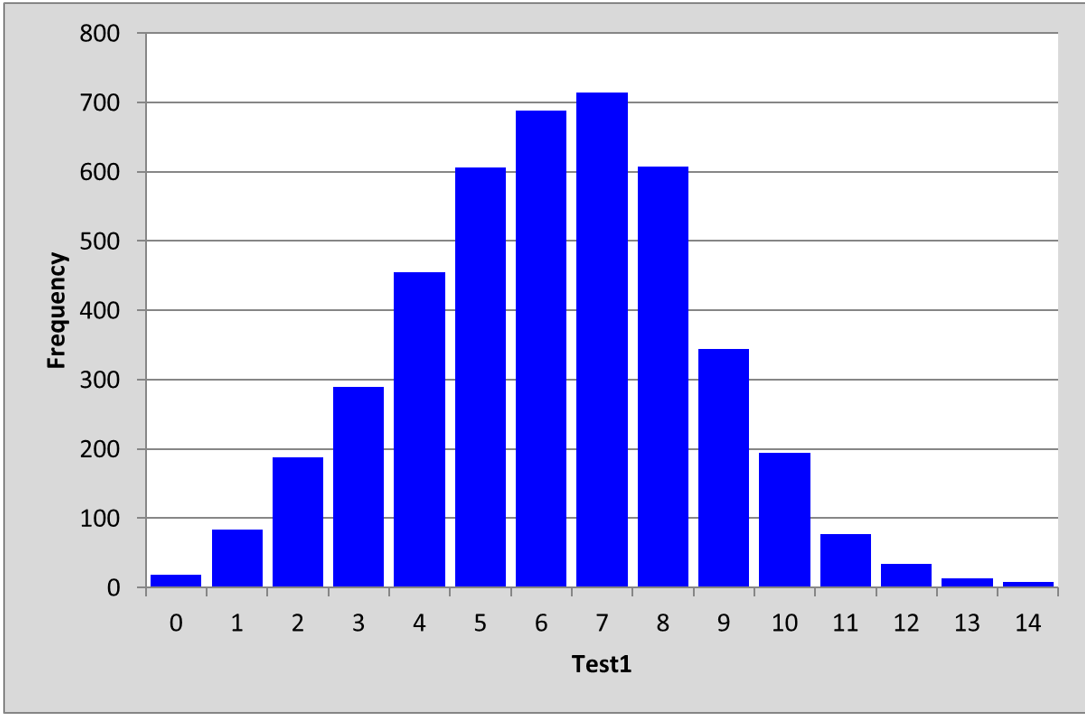
The mean of the scores for the Australian students was: 6.19, the standard deviation, s.d., was 2.37.
The mean is also known as the "average".
The histogram below displays the scores of 2,051 Japanese students on the same 14-item maths test:
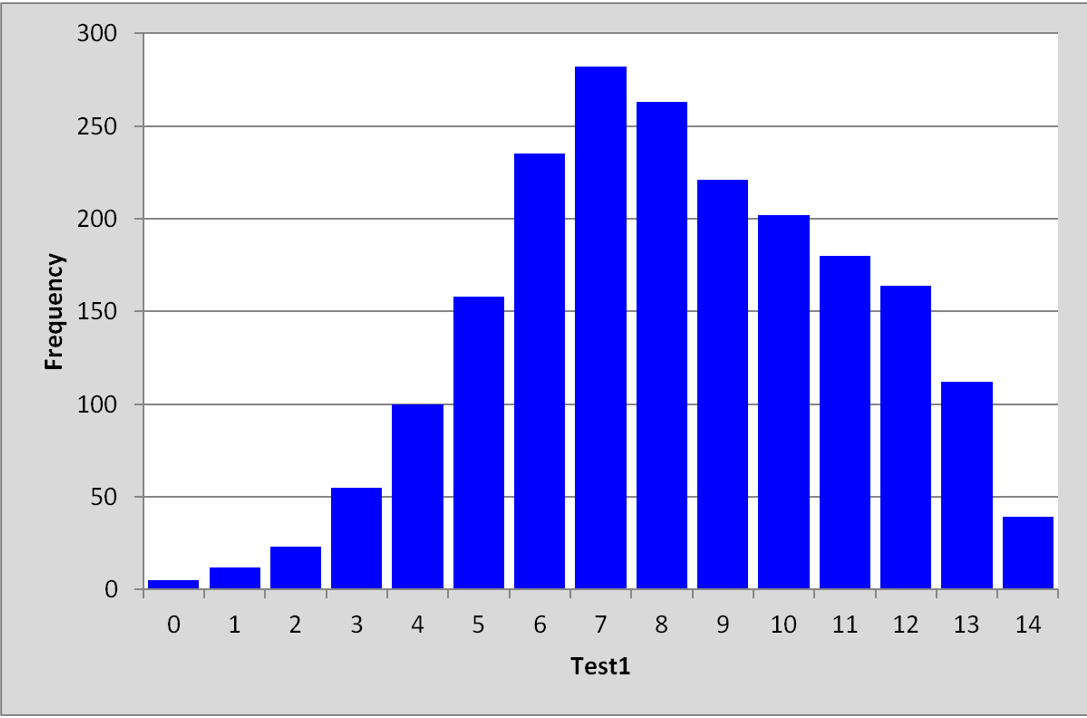
The mean of the scores for the Japanese students was: 8.22, the standard deviation, s.d., was 2.86.
(What can we say, what conclusions may we make? Well, we can say this: the Japanese students did better on the test; their average was higher. The spread of scores, the way they were distributed, is what the standard deviation in meant to tell us. In this case the s.d. values were quite similar.)
The histogram below indicates the distribution of test scores for 4,363 high school students who sat a 92-item mathematics test in India in the year 2003:
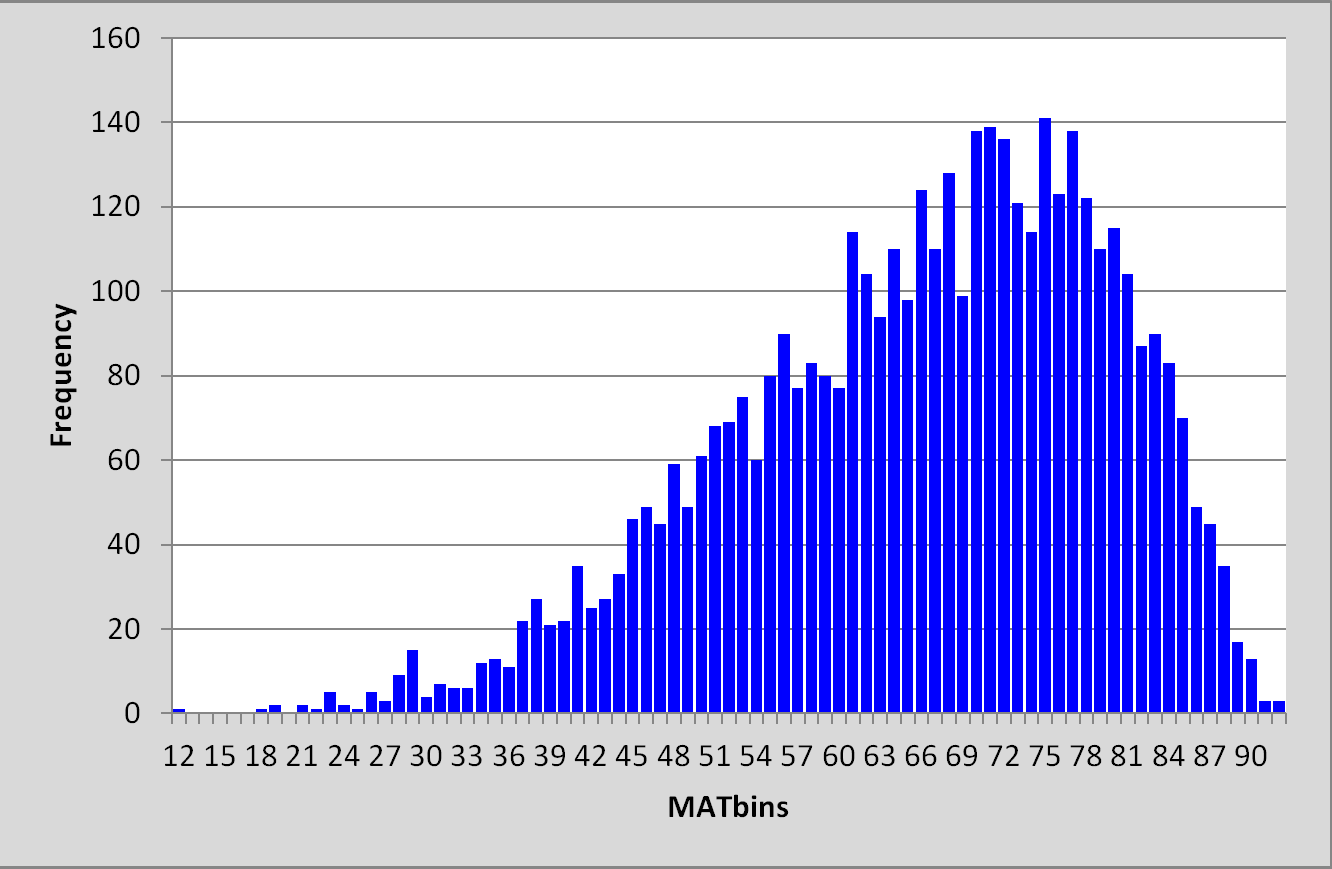
The mean test score for the Indian students was 65.91, the standard deviation, s.d., was 13.52.
The test scores for these students are quite spread out, ranging from 12 to 92. The s.d. value of 13.52 reflects this.
Message: s.d. means standard deviation. It's a statistic which indicates how spread out scores are. Here's a reference.
Okay, going well (?).
Correlation is what I next want to mention, and fortunately there's a fine website available so that I don't need to make my own displays. We'll look at it if the internet is up and running. Here's the link. (Fingers crossed, will the link work?)