Packed Cleaned Plots

Contents
The bouquet of "cleaned" quintile plots seen below was obtained by using another Lertap macro called "ChartChanger4".
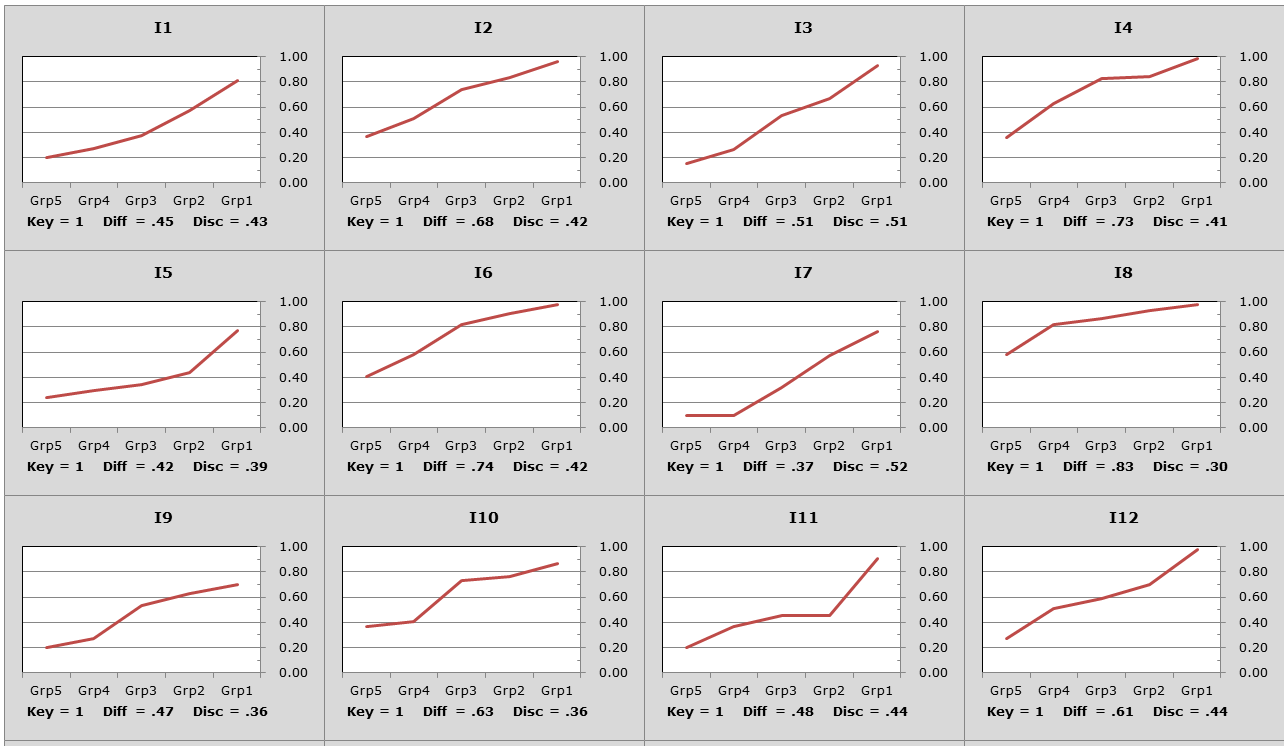
A likely use for these plots may be appreciated by users who want to check to see that the response trace line for an item's keyed-correct option rises from left to right across the plot. This is almost always desired, especially when users are thinking about moving on to some sort of IRT analysis (item response theory). A hiccup in the rise may make it difficult for an IRT program to find model fit, as was the case when I40 was processed by two of the most popular IRT programs, Bilog-MG 3 and Xcalibre. (I40's plot is seen on the previous page. The I40 trace dips at Grp2, an undesirable outcome.)
Note that it is possible to change the number of groups used in these plots. There may be as many as 10 groups. This topic mentions how to change the number of groups from the default setting of five.