Sample results, page 1

Contents
The 3 Steps resulted in a veritable swag of new "reports", or worksheets, going from Freqs to Scores to Stats1f to Stats1b, and so on, out to csem3, and Stats3ul, no less than 14 new, whopping worksheets to study. (Our computer, low on sugar, took about 4 minutes to complete the Steps.)
Were there any data processing errors? Freqs, what say you?
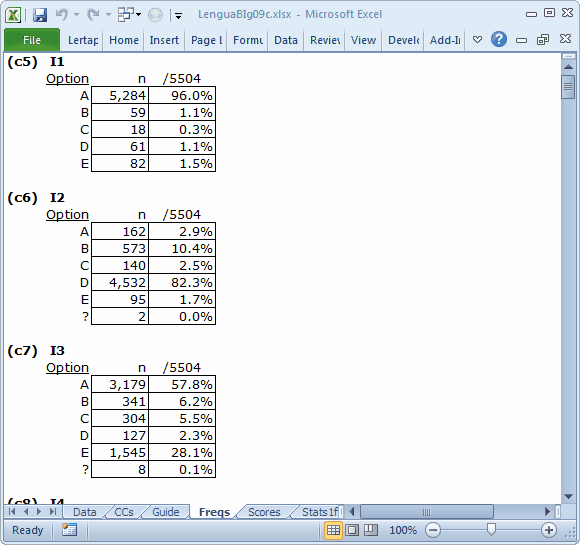
These results were prepared by submitting mark-sense answer sheets to a scanner. The scanner "wrote" a blank whenever a student did not answer a question, or whenever the student's answer was impossible for the scanner to decipher (this will happen when a student shades in more than one answer, for example). In the Freqs report, blanks are tallied in the ? row.
I38, not shown here, had a tally of 20 in the ? row, which is just 0.04% of the total number of students, 5504. Most items had far fewer tallies, as seen above for I1, I2, and I3. All okay.
What about the possibility of score outliers, very low scores which may indicate a bad record (row) in the Data worksheet? We'll focus on the Scores worksheet, and get a histogram for the first score, which is called "Core".
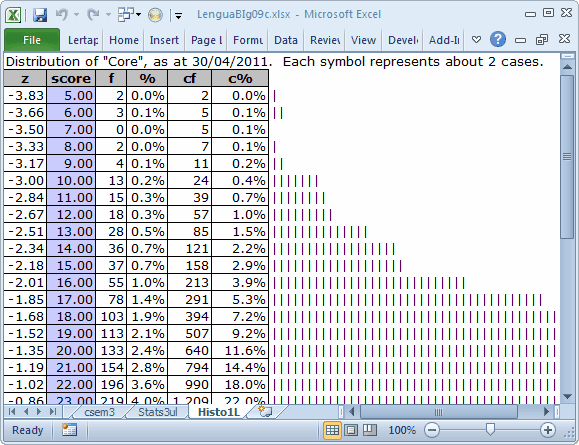
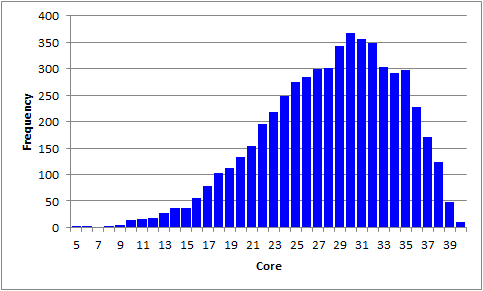
There do seem to be some curiously low scores. We've got three scores of 6.00, and two of 5.00. We should find out who they were, something which is not difficult to do. First, we made sure the Scores worksheet was in view, then went to the Data tab on the Excel ribbon, and selected Filter. We asked for a filter of 5.00 and 6.00 on column 2, where the "Core" scores are located. We made note of the IDs of the students who had these scores, went over to the Data worksheet, and used Find (on the Home tab) to look at their item responses. We found nothing unusual -- the students seemed to have taken a stab at each item. (In truth, we only looked at the Data records corresponding to a score of 5.00, and there is something unusual: the IDs are really birth dates, so it's possible to have two or more records with the same ID.)
Okay then, the data seem to be in order.
Our goal here is to look at the quality of the ten trial items. We'll do that in the next topic.
But first, let's just have a quick squiz of the results for the "Core" test, the 40 items which were scored.
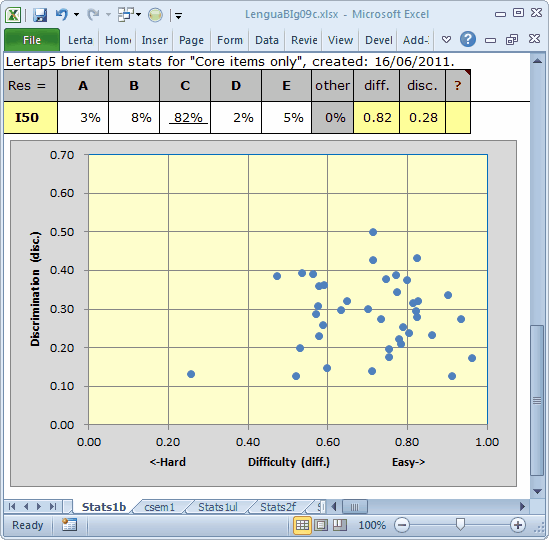
There are quite a few easy-ish items, that is, questions whose diff. values are greater than 0.80 This isn't necessarily bad, especially if the test falls into a "mastery" sort of exam, which this one does: students had to have a score of at least 50% in order to pass (corresponding to a score of at least 20 on the 40 items). In this case, 4997 students passed, 91% of all students, something which is easy to determine by using the Histo1L "report".
The Stats1f report will give us some crucial data, such as coefficient alpha, the reliability figure computed by Lertap.
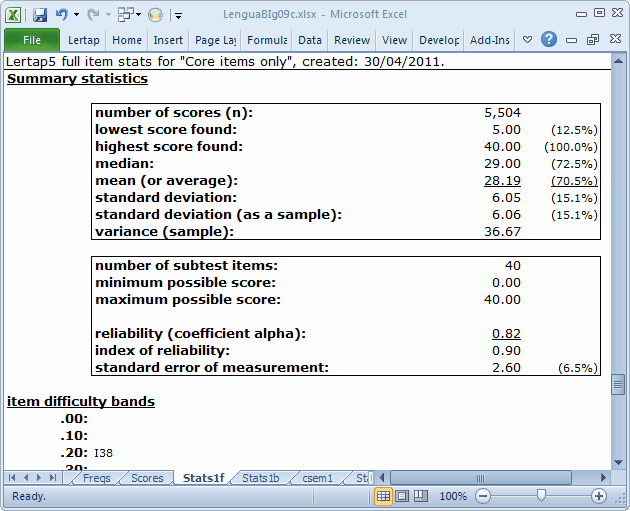
A reliability of 0.82 might be acceptable; could have been better, maybe. What's missing are items with disc. values above 0.40. We've only got three (refer to the scatterplot above).
We could use the Spearman-Brown formula to see what the test's reliability would be if we added 20 items; then we could make some comparisons to the three 60-item tests discussed in the M.Nursing sample. We did this, and found we'd have a test with a reliability of 0.87 if we could add 20 items to the present test, items with similar statistical characteristics. That's better, but, this being a pass-fail test, a statistic which might be as important as reliability, if not more so, would be the "Prop. consistent placings" index. Finding what that might be is left as an exercise; download this dataset and see what you find.
Let's move on, looking for an answer to our basic question: were the trial items any good? Advance!