Sample results, page 2

Contents
What about those ten trial items? Were they any good?
A simple way to answer this question would be to compare the reliability of the "Core" subtest and the "All" subtest. We already know the former from the previous topic: 0.82 is the reliability for the 40-item core subtest.
Here are the stats for the "All" subtest, with 50 items:
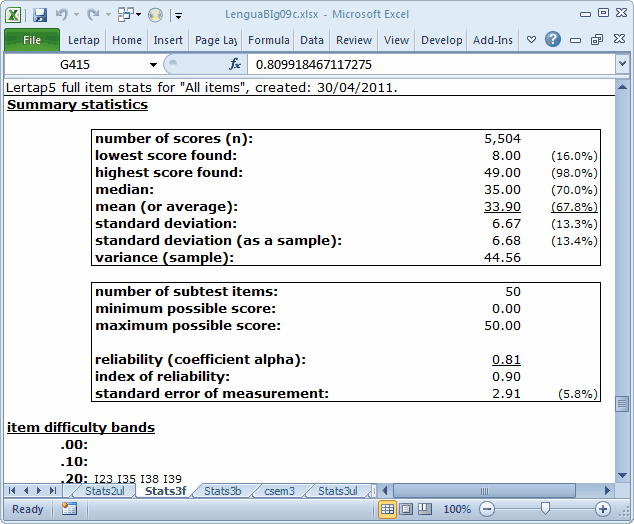
The reliability has gone down a bit, to 0.81. Still sort of okay, you say? Not really. Adding items to a test should increase reliability.
Here is another chance to benefit from application of the Spearman-Brown formula. Adding 10 items to our 40-item test should, by Spearman-Brown, take the reliability to 0.85; we'd truly expect this to happen if we were adding items whose quality was equal to that of the original items. Obviously, our ten new items are either of lower quality, or are just not testing the same concepts as the original items.
Here's that nifty scatterplot of item diff. by disc. for the 50-item subtest, "All":
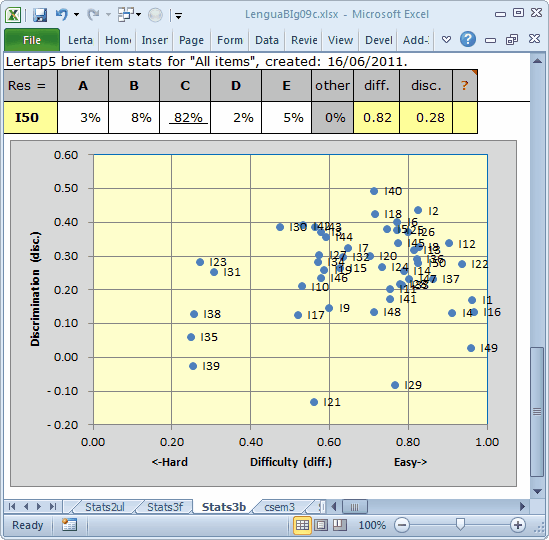
We didn't have any items with a disc. value less than 0.10 before. Now we have five. Three of these five are negative, always a bad sign. (Note: Lertap always shows item names next to their blips in the scatterplot, as shown here. To delete the names, right-click on just one of them, such as I39, and choose Delete.)
Obviously, things are not going well for our ten trial items.
We will get more detail by going through an external criterion analysis, an option available on the Run menu's More option, just under the Elmillon option.
We selected the "Core" score as the external criterion, and then the second subtest, "Trial", as the one having the items to be correlated with the external criterion.
This added another two reports, ECStats2f, and ECStats2ul.
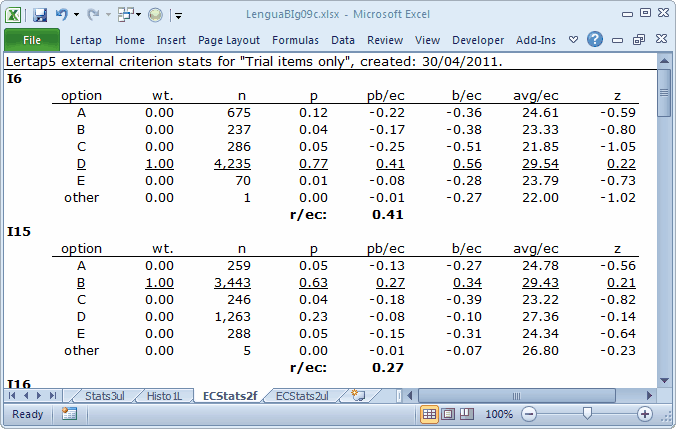
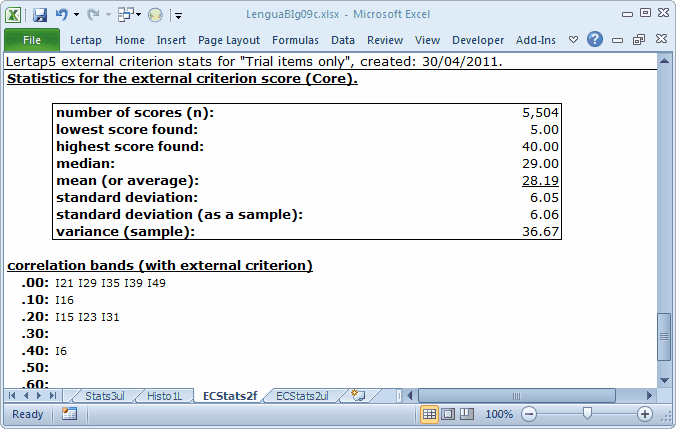
The ECStats2f report is not quite the same as an ordinary Statsf report. The criterion score used for the four statistics columns, pb/ec, b/ec, avg/ec, and z are all based on the external criterion score, which, for this analysis, is "Core", the score on the 40 core items. But what we want to see is the same sort of pattern we ordinarily look for in a discriminating item: the highest avg/ec value should be found for the keyed-correct answer.
Avg/ec is the average score on the external criterion, "Core", found for those students who selected the corresponding option. For example, on I6 the keyed-correct answer is D, underlined to remind us that it's the right answer. The average "Core" score for the 4,235 students who chose this option is 29.54. Meanwhile, the average "Core" scores on I6 for those selecting any of the four distractors are below the over-all "Core" average, which was 28.19. Note: the z column makes it easy to see if avg/ec is above or below average: above and z is positive; below and z is negative.
The r/ec figure found in ECStatsf reports is the correlation between the item and the external criterion. In technical terms, it's not a point-biserial (pb) correlation coefficient, nor is it a biserial (b) coeffcient. It's what's known in the business as the Pearson product-moment correlation. If an item is scored on a dichotomous basis, right-wrong, then r/ec will be the same as the pb/ec value for the item's correct answer.
What do we want to see for our ten trial items, as far as r/ec goes? Well, first of all, a positive value. Secondly, a large positive value. What's large (does size matter)? Preferably above 0.30. If hard-pressed, we might accept anything at 0.20 and above. If at or above 0.40 we'll pin a gold star on the item.
I6 and I15 performed well and well-enough, respectively. I6's correlation with the criterion, r/ec, is 0.41, a gold-star outcome; browsing down the avg/ec and z columns shows a good pattern for I6 (and I15 for that matter), with a positive z for the correct answer (the "key") of D (or B, in the case of I15). These two items would be "keepers"; adding them to them to the core test would improve reliability (you could try it yourself instead of just sitting there, reading; you know what a lack of exercise will do).
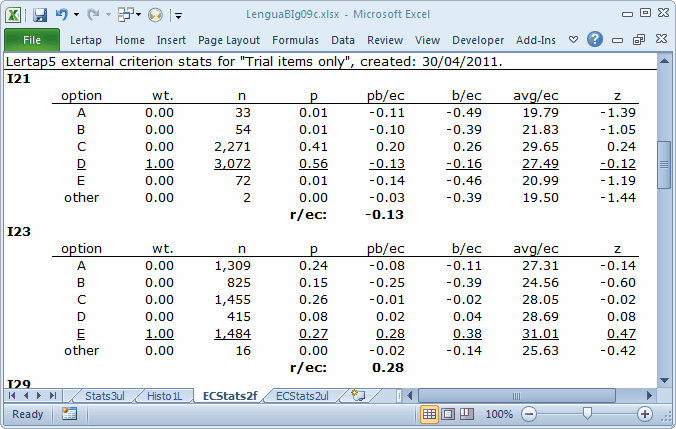
I23 might be another keeper, but probably not I21. The z for I21's correct answer is negative. The average "Core" score for the 3,072 students who selected option D on I21, the keyed-correct answer, is below the overall "Core" average of 28.19.
The following little table indicates that only four of the ten items show promise: I6, I15, I23, and I31. This is seen in the correlation bands (with external criterion) table. This table is based on the items' r/ec values. We have five items, I21, I29, I35, I39, and I49, in the "sin bin", with r/ec values less than 0.10. In fact, of these five, items I21, I29, and I39 have negative r/ec's. (You need a copy of the whole ECStats2f report to confirm this, and, yes you can get one -- download the dataset.)
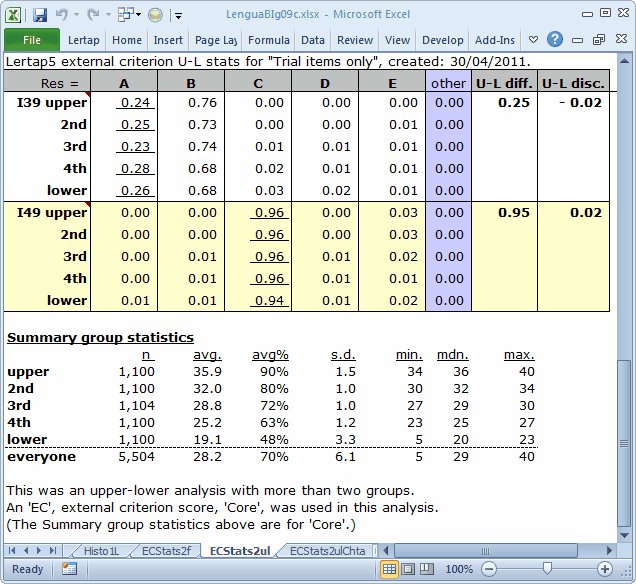
The bottom of the ECStats2ul is that of an ordinary Statsul report, with an important distinction: the five quintile groups have been formed on the basis of the external criterion score. This score also serves as the foundation for the quintile plots which may be made from an ECStatsul report. (See how.)
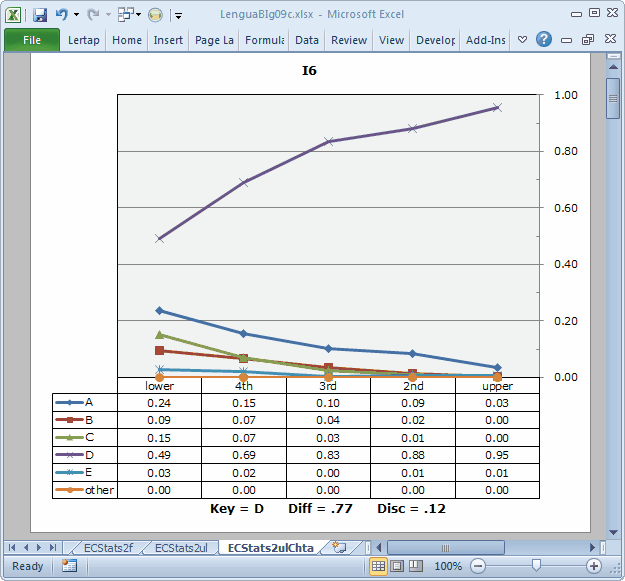
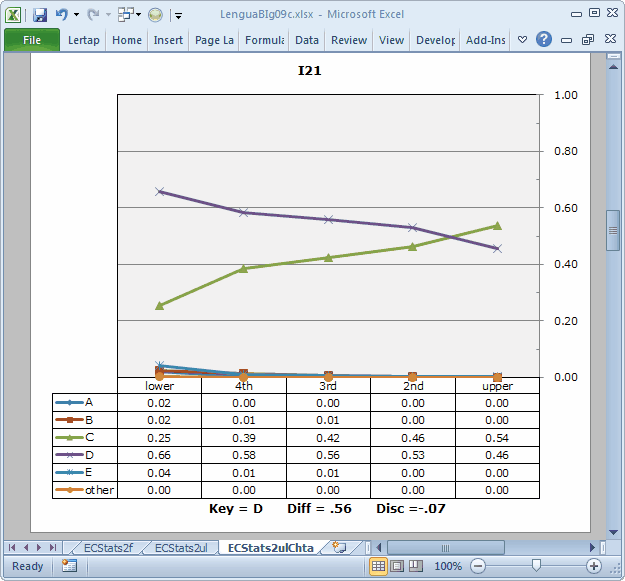
Note: the Diff and Disc values in these plots are taken from the subtest's Statsb report. In this case, the subtest is the 10-item "Trial" subtest, and the corresponding report is Stats2b. These values are not very meaningful here; we have no real interest in that subtest on its own. We can ignore the Diff and Disc values, just taking in the "picture".
The plot for I6 is not bad. The trace of the correct option's response frequencies rises from left to right. This is the desired pattern for an item meant to discriminate: the strongest students, those in the "upper" group, are more likely to get the item right. At the same time, the popularity of the four distractors is greater on the left, falling off as we move to the right so that, by the time we get to the "upper" group almost no-one has been distracted by a distractor.
Not so for I21. Only two options, C and D, caught the attention of the students. Of these, D is the keyed-correct answer, but its trace line resembles that expected of a distractor, dropping from left to right when we'd expect it to do the opposite. Option C, a distractor, gains in popularity, or "endorsement", as we move from left to right, ending up as the most-selected option in the "upper" group. This is an undesired pattern for a distractor.
It could be that I21 has been mis-keyed, as was the case for I11 in our MathsQuiz sample. However, the signs are still not too promising; even should this have been the case, there would be too many people in the "upper" group selecting a distractor (which is what option D would become if we changed the keyed-correct answer to C).
Well, it seems that this palavering has stunned today's audience. People are texting on their phones, and some of them are good at it, too, looking ahead as though they're paying attention while, out of vision, their thumbs are busy. Some are taking a nap. No-one has asked a question. No-one even looks like they're about to as a question.
Ah, but wait! That principal from Harvard senior high school, Harriet, is alert. She says: "Larry, this is all simply spectacular. I've had my laptop going all this time. I've downloaded this dataset, and will shortly work through it on my own. My goodness, Lertap is a marvel! Wait until I tell Ozzie about it tonight before he falls asleep! But, really, is this external-criterion analysis really required? Couldn't I just get into the various reports for the third subtest, 'All', and wouldn't I be able to see how the ten items are working?"
A good point. Indeed, scrolling this topic up to once again take in the "nifty scatterplot of item diff. by disc. for the 50-item subtest" shows our sin-bin quintet, I21, I29, I35, I39, and I49, at the bottom.
To follow up on Harriet's point, what we should do is make a little table. It'll have ten rows, one for each of the trial items, and two columns. The first column will have the r/ec values from the ECStats2f report; the second will have the disc. values from the Stats3b report, which, incidentally, are the same as the pb(r) values found in the Stats3f report. It's an interesting little exercise. You can do it yourself if you download this dataset.
You'll find that we should pin a gold star on Harriet; a comparison of the two columns will reveal only three differences, and they're very slight differences.
The ratio of core items to trial items in this sample is 40 to 10, 4-to-1. Should this ratio be lower, say 3-to-1, we might well expect our little table to show more differences. An external-criterion analysis would be the most advisable way to go about this business of checking the performance of trial items. However, in this case, it didn't make all that much difference; we would have concluded the same thing had we just run with two subtests, the 40-item core items, and "All", the 50-item subtest.
What conclusion? Four of the ten items, I6, I15, I23, and I31 are worthy of keeping, and might be included in a future version of the test.
More?