Exercises

Contents
There are a number of exercises which could be thought of as activities for a rainy day. They won't hurt, and an ability to shuffle data around, between this program and that program, is something which can be handy to cultivate.
In this topic, CTT refers to "classical test theory", while IRT refers to "item response theory".
Both theories provide estimates of item difficulty and discrimination (although IRT's 1PL, or "Rasch", model does not -- it assumes all items have the same discrimination, and it consequently concerns itself only with item location, which is directly analogous to item difficulty).
Let's say that we wanted to compare the item parameter estimates from the two approaches. Yes, this has been done quite a number of times, and you might already be familiar with the literature in this regard. But pretend you're not.
What we could do is take the CTT estimates of difficulty and discrimination from Lertap, and the IRT estimates from Xcalibre, paste them into Excel columns, and then get some scatterplots.
Both programs make it a pretty simple task to do this. Lertap's Stats1b report, an Excel worksheet, has the CTT estimates. Xcalibe 4 has an option to "Save the item parameters" in a csv (comma-separated values) file, which Excel likes.
We'd need to select a dataset to work with. The larger the sample, the better. There are four datasets in this website that have a substantial number of data records: MathsQuiz (n=999), M.Nursing (n=1,768), LenguaBIg (n=5,504), and LaFlorida (n=11,109). Of these, LaFlorida is not suitable as its items were exceptionally difficult, with many students failing to answer numerous items.
Let's say we take M.Nursing. We get Lertap to produce the data matrix and item control files required by Xcalibre 4. We turn on Xcalibre's option to "Save the item parameters". We open a new Excel workbook. In column 1 we put item number. In columns 2 and 3 we paste the diff. and disc. values from Lertap's Stats1b sheet. In columns 4 and 5 will go the "a" and "b" parameter estimates from Xcalibre. Bob's your uncle; we're set to party.
(Note: "To halve and hold" is an option used to create random halves from any Data worksheet. Add life to the party by splitting another dataset, LenguaBIg, into halves, and then comparing results. You could even split the halves into halves, getting quarters, and then compare results. And then, you could split the quarters ....)
Here's another example; same theme, different leg action:
Lertap has an option to produce estimates of 2PL IRT item parameters. It's activated by turning on the "experimental features" option.
We could compare these Lertap estimates with Xcalibre's, setting the "2-parameter (a and b)" option via Xcalibre's "IRT model" tab.
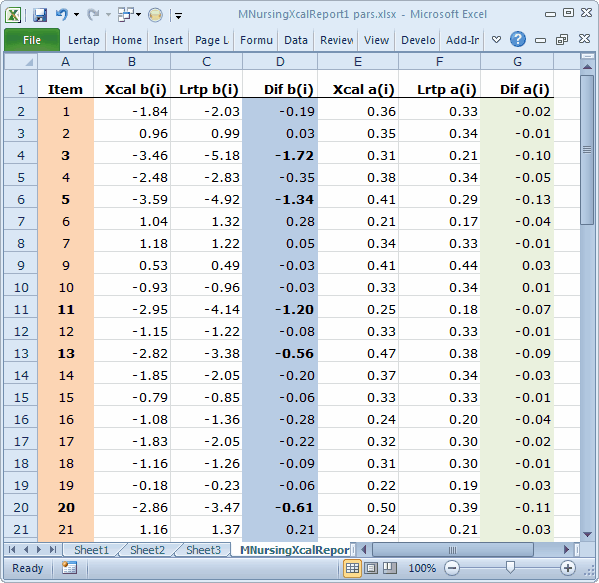
Here's how our working Excel workbook looked:
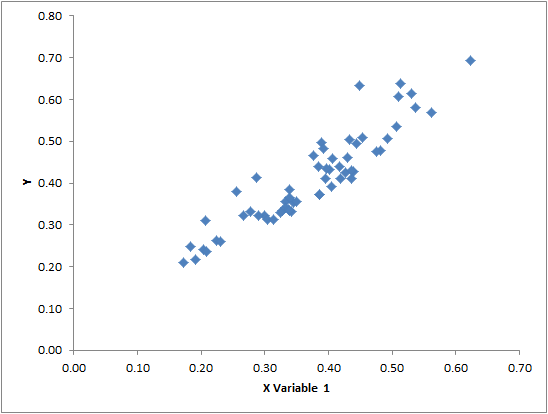
An Excel-made scatterplot of the two a-parameter estimates:
An SPSS scatterplot of the two b-parameter estimates:
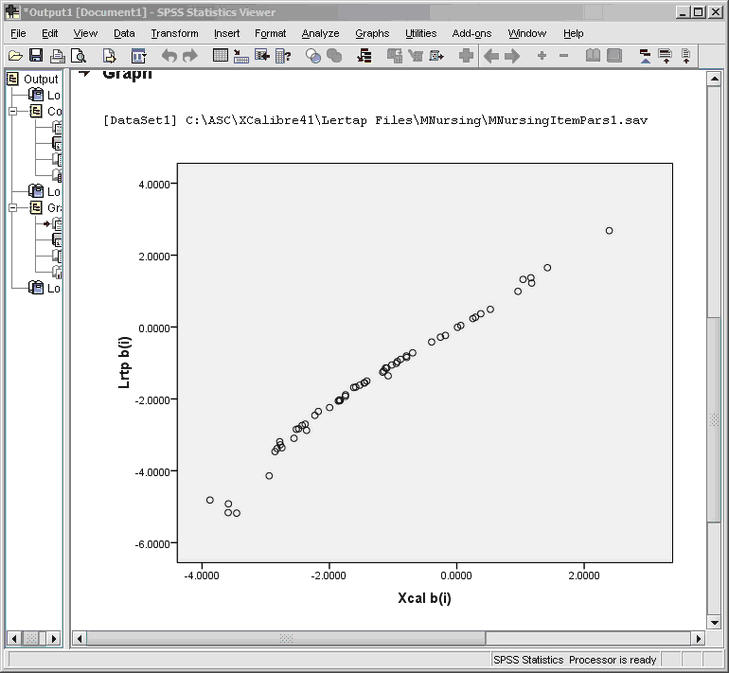
What might be your guess as to the values of the correlation coefficients for these two scatterplots? Excel and SPSS output the values, but we'll leave you guessing.
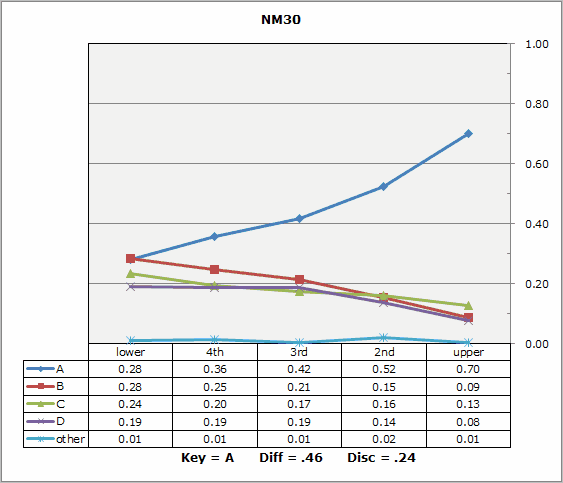
Another exercise to consider: trying to discern similarities between Lertap's quintile plots, and Xcalibre's item characteristic curves. Here is just one example:
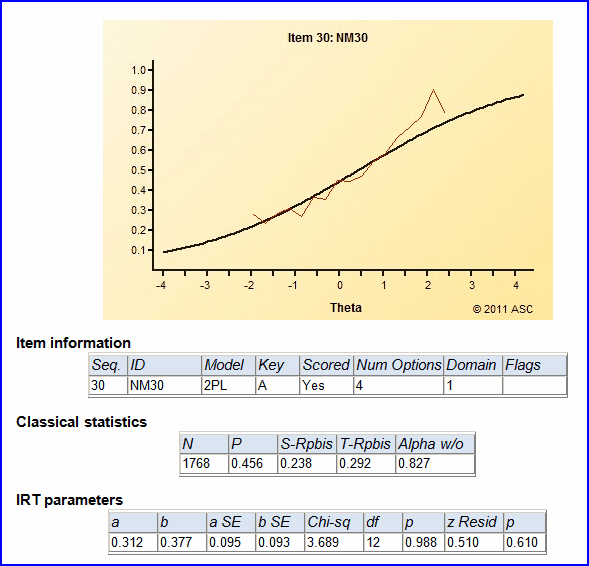
Note: this is not to suggest that Lertap is a dinkum IRT program. It is not. It does not strive to be. However, its estimates of the 2PL IRT parameters might be of use at times.