Full item statistics

Contents
By far the longest section in any Statsf report is that which has the detailed item statistics. Here you will find a table of results for each test (or subtest) item.
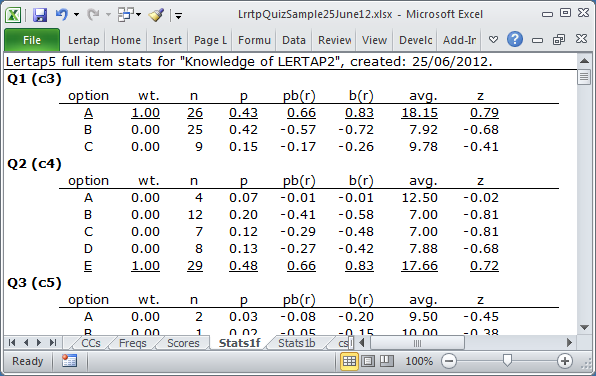
The screen snapshot above shows results for items from the 25-item cognitive subtest found in the "Lertap Quiz".
The items in this subtest used upper-case letters as response options. Sixty (60) students took the test.
The table below provides an interpretation of the column headings seen in the report.
option |
The response option selected by the student. Response options may be letters (upper or lower case) or digits (from 0 to 9). If the option corresponds to the keyed-correct answer, then the option is underlined, as are all the statistics for the option. |
wt. |
The number of scoring points given for selecting the option. |
n |
The number of people who selected the option. |
p |
The proportion of people who selected the option. Multiply this by 100 to get the corresponding percent. In the example above, 43% of the students selected option A on Q1. If the option is the keyed-correct answer, then p is usually referred to as "item difficulty". Thus, the difficulty of Q1 is 0.43. In the Stats1b report, p is "diff". Note that an item with a difficulty of 0.80 would be referred to as an "easy" item as 80% of the students got it right. Conversely, a difficulty of 0.20 would be a "hard" item as only 20% got it right. |
pb(r) |
The point-biserial correlation with the criterion score. To compute this, all those who selected the option are given a "score" of 1 while those who did not are given a score of 0. These scores are then correlated with the criterion score. If the option is the keyed-correct answer, then pb(r) is usually referred to as "item discrimination". In the Stats1b report, pb(r) for the keyed-correct answer is denoted as "disc". The pb(r) values will range from -1.00 to +1.00. Items with a discrimination of at least 0.30 are often referred to as having good discrimination. Above, both Q1 and Q2 would be said to have good discrimination as their pb(r) values for the correct option are above 0.30. (Lertap corrects pb(r) values for "part-whole inflation" whenever the item is part of the criterion measure.) |
b(r) |
The biserial correlation with the criterion score. Sometimes the option selection "scores" of 0 and 1 used to compute pb(r) are regarded as a dichotomous code for an underlying, or "latent", variable having a range of scores. If we assume the latent variable to have a "normal" (or Gaussian) distribution, then a well-known equation may be applied to pb(r) to derive b(r), which is then taken as an estimate of the correlation between the latent variable and the criterion score. Note that it is possible for b(r) to be greater than 1.00. |
avg. |
The average criterion score for those who selected the option. On Q2 (above), the 29 students who selected option E, the keyed-correct option, had an average criterion score of 17.66. In this case, 17.66 is the mean test score for these 29 students -- the "criterion" is the test score. The test had 25 items, and all items were scored on a right-wrong basis, with 1 point for right, 0 otherwise. The maximum possible criterion score is thus 25. When the "criterion" is the test score itself, it's called an "internal criterion". At times an "external" criterion measure is on hand, and item performance may be assessed by correlating item results with the external criterion score. Please refer to this topic for more information. |
z |
avg. expressed as a "z-score". Sixty (60) students took our 25-item test. Their average test score, that is, the mean of the 60 test scores, was 12.63. The standard deviation of the 60 scores was 6.95. With these two figures on hand, the "z score" for the 29 students who selected option E on Q1 is (17.66 minus 12.63) divided by 6.95, or 0.72. z-scores are "standard scores". No matter what the test mean and standard deviation may be, when z-scores are formed, the mean of the z-scores will always be zero (0.00), and the standard deviation will always be one (1.00). A positive z-score occurs when the original score is greater than the overall average criterion score. z-scores are frequently interpreted by making reference to the "normal curve". A z-score of 1.00 in a normal distribution is at the 84th percentile; only 16% of all test takers will have a z-score higher than 1.00. A z-score of -1.00 in a normal distribution is at the 16th percentile; only 16% of all test takers will have a z-score less than -1.00. (More about z here.) |
Consider now another test, a 15-item mathematics quiz given to 999 high school students.
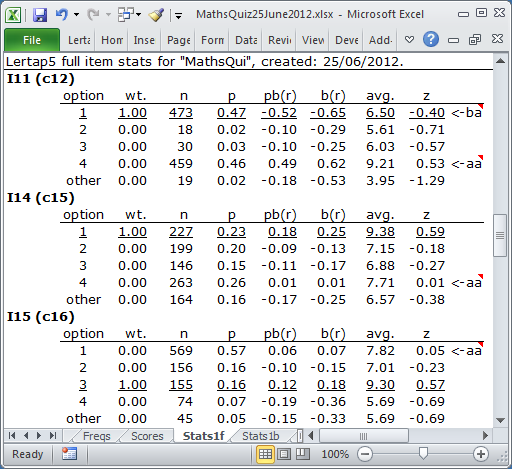
Three items from the maths quiz are on display in the screen snapshot above. They have been selected in order to show how Lertap "flags" item options which may have problems.
There were 15 items on the quiz, all scored on a right-wrong basis, with one point given for each correct answer. The overall mean test score was 7.67 with a standard deviation of 2.88.
Now, if an item is meant to be one which helps us identify the strong students, we expect that those who get the item right will be the best students. Those who get it wrong should be the weakest students
This did not happen on I11. The keyed-correct response was option 1, selected by 473 students. Their avg. test score was 6.50, corresponding to a negative z-score of 0.40. The last option, 4, was selected by 459 students whose avg. test score was 9.21, with a positive z-score of 0.53. Weak students are getting I11 right, while strong students are getting it wrong.
To draw our attention to this, Lertap has "flagged" I11 twice. We've got a "ba" flag for the first option, and an "aa" flag for the last option.
The "ba" flag appears whenever an option with a wt. above 0.00 has a negative z value. "ba" means "below average". This flag will wave whenever the students who select the keyed-correct option have a below-average test score (we expect such students to have an above-average test score).
The "aa" flag will show whenever an option with wt. at or below 0.00 has a positive z value. Here, "aa" stands for "above-average" -- it'll come out to flap in the breeze whenever a "distractor" (an incorrect option) is selected by above-average students. This is an unwanted outcome as we expect the above-average students to get the item right.
What has happened is that I11 has been mis-keyed. The correct option on I11 was 4, not 1. An error was made when the *key line was typed into the CCs worksheet. Once this error is corrected we can expect Stats1f to display no flags at all for I11.
Why has Lertap flagged I14 and I15? Because both of these items have a distractor selected by students with above-average test scores. The flagged distractors for these two items have z values just above zero, meaning that the students who selected them were slightly above average. This is unexpected. It probably indicates that the items need to be reviewed -- what is there about these distractors which has made good students see them as plausible? (Asking the students is likely to uncover the underlying reasons.)
There is one more flag which may appear in a Stats1f report. It's "<-no". It will appear whenever an item option has not been selected by anyone.
It is possible to stop Lertap from using these flags in its Stats1f reports. There is a setting in Row 58 of Lertap's System worksheet which controls it.
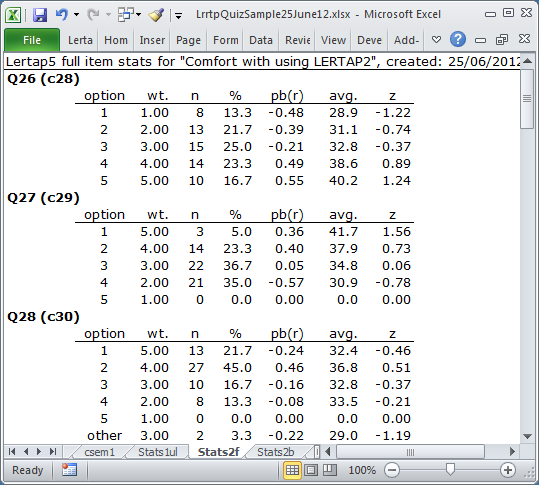
The Stats2f report seen above shows how the detailed item statistics look for an affective subtest, in this case the 10-item survey included in the Lertap Quiz dataset.
In contrast to cognitive items, where most often only one of an item's options will be scored (that is, have a wt. which is above 0.00), each option on an affective item is usually scored. The three items pictured above, Q26, Q27, and Q28 all use five options: {1,2,3,4,5}. A student who selects the first option on Q26 will get one point. Selecting the first option on Q27 and Q28, on the other hand, will "award" the student with five points.
These items are example of polytomous scoring. To read more about how Lertap deals with items of this sort, please branch to this topic.
What happens when students don't answer questions, or are not given the opportunity to answer all questions? How does Lertap go about scoring in these cases? See the missing data topics to find out.
Finally: see the manual! There is much more about item statistics in the manual, and it's not a difficult read at all.
Related tidbits:
Flags are also waved in Stats1b reports, where they appear in the ? column. Read more.
The use of flags in Stats1f reports is controlled by an "Annotate Stats-f reports" setting in the System worksheet (it is possible to turn them off).
Chapter 7 of the manual has a more in-depth discussion, with references to relevant literature. It may be the most popular chapter in the manual, sometimes used in test and measurement classes. Get a pdf copy of this chapter with a click here.
An easy-to-read technical paper with more details about how Lertap 5 calculates item correlations is available here.
How to print Lertap's reports? Not hard at all, especially if you take in this topic.