Item-level results

Contents
The "item responses by groups" option will let me compare Standard 4 and Standard 5 differences by item.
Here are some examples.
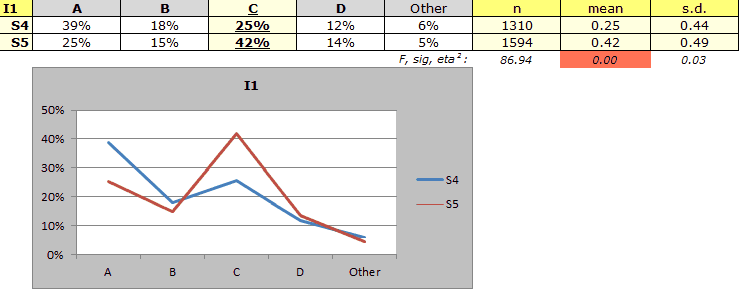
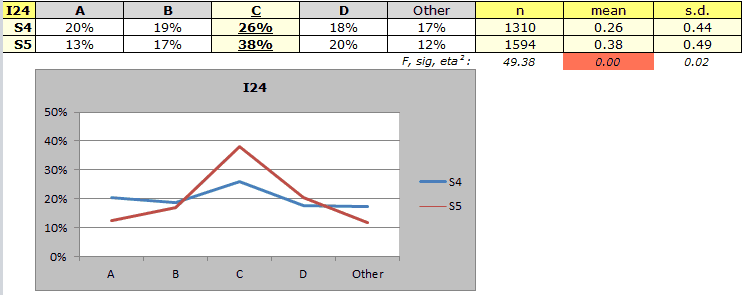
S5 (Standard 5) students were more capable of identifying the correct answer on the first item, where 42% of S5 kids got the right answer, compared to 25% of the S4 students. Other items where the difference was at least 10 percentage points: I2, I3, I5, I7, I10, I11, I13, I14, I18, and I24. The S5 students did better on all of these items by at least 10 percentage points.
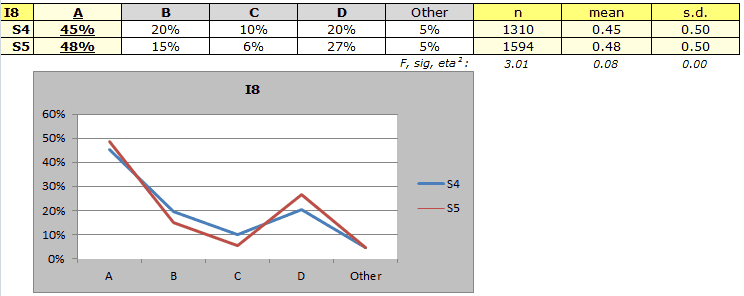
The eighth item, I8, was one of the few where response differences were slight. However, on all 24 items, S5 students had an edge; there was not a single item where the S4 students did better.
The "Other" column in these little tables indicates the percentage of students who had an "answer" of 9 to an item. For the first few items, these percentages were quite similar, as they are above for I1 and I8. But, towards the end of the test, S4 students were more likely to leave questions unanswered. Look at the results for the last item:
Age a bit in the next topic.