Double keying items

Contents
I have two items whose scoring is to be changed: I8 in column 12 (c12) of the Data worksheet, and I15 in c19.
I8 is to have two correct answers, A and D -- a student selecting either of these answers will get a point.
I15 is also to have two correct answers, B and C -- a student selecting either of these answers will get a point.
Ready, set, go. I add some new lines to my CCs worksheet. Behold:
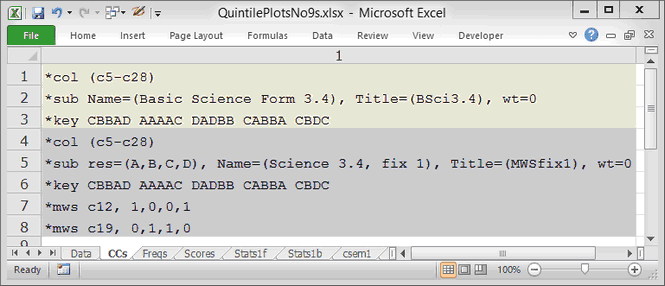
Relax, stay with me, the bell has not rung yet. I'll explain what I've done.
The first three rows are the same as before, except for the little wt=0 at the end of *sub. These three rows define what Lertap will automatically call "Subtest1". Its title is BSci3.4.
Now I've added another "subtest" with a title of MWSfix1. This subtest uses the same items as the first subtest: the *col lines are the same for each subtest. And the *key lines are the same for each subtest.
The big change is seen in rows 7 and 8, where I've added two *mws lines.
"mws" means multiple-weights specification. For the item found in c12 (column 12) of the Data worksheet, students will get a point if they select either the first or the fourth option. For the item found in c19 (column 19) of the Data worksheet, students will get a point if they select either the second or the third option. (A reference for *mws is here.)
Lertap will now create two scores for each student, a BSci3.4 score, and an MWSfix1 score. The little wt=0 entries at the end of the two *sub lines keep Lertap from adding these two scores together to make a "total score". These wt=0 things are not crucial at all; with them the Scores worksheet will have just two results columns, one for BSci3.4 and one for MWSfix1; without them the Scores worksheet will have three scores, BSci3.4, MWSfix1, and "Total", the sum of BSci3.4 and MWSfix1. In this case adding the two scores doesn't make sense as they're based on the same 24 items. (An example where a total score was wanted is here.)
After I've used the Interpret and Elmillon options, the bottom of the Scores worksheet looks like this:
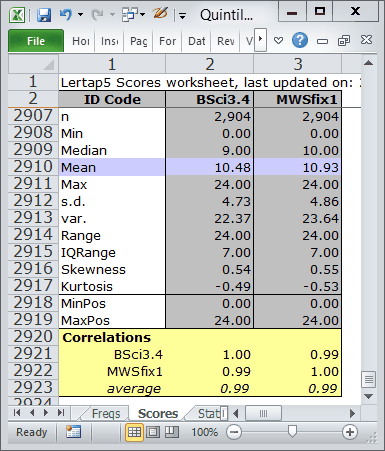
After double-keying I8 and I15, the Median test score increases by one point; it's now 10.00. The Mean (or average) test score goes up too, from 10.48 to 10.93.
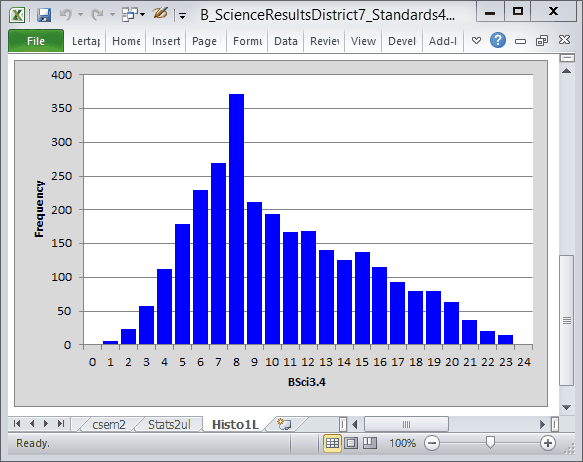
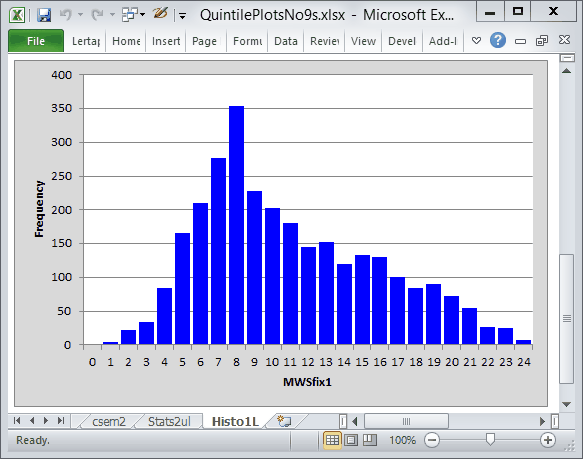
Look carefully, clean your glasses, and you'll spot some differences in the two score histograms. The top one is "before"; the bottom one is "after". There are more high scores now; compare the height of the bars starting at about a score of 13.
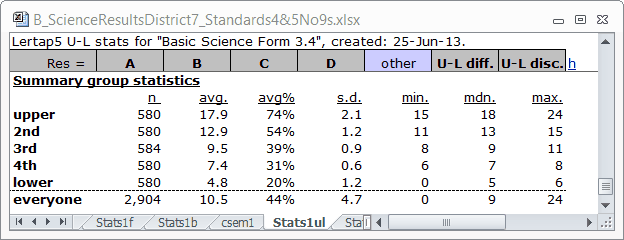
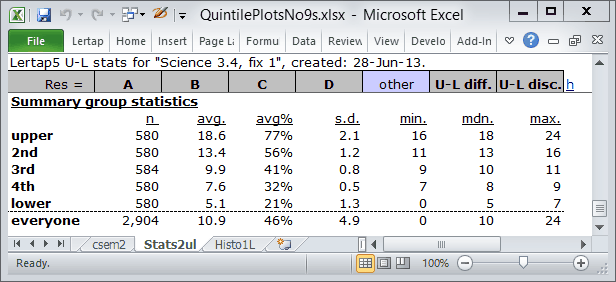
The "Summary group statistics" (above) have changed in an expected manner. Comparing the two "avg." columns indicates that all five groups have benefited from the new scoring.
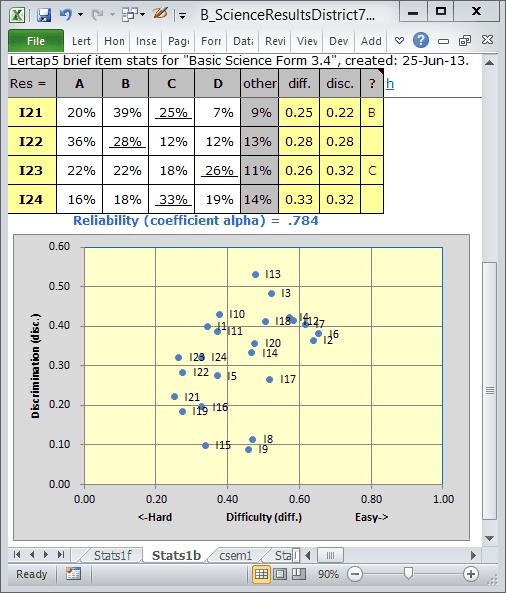
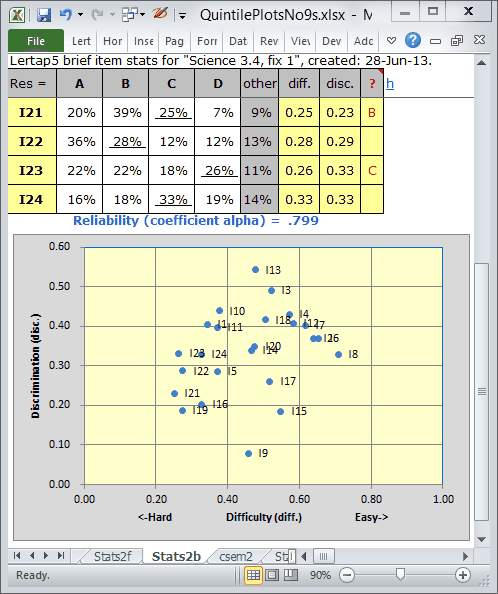
Here (above) there are some interesting changes. (The top scatterplot is "before"; the bottom is "after".)
The reliability has increased, moving from .784 to .799. Note that the two items which have been double-keyed have shifted in the scatterplots. I8 and I15 were at the bottom before, next to I9. Now they've improved, with I8 becoming particularly attractive with its discrimination now above the 0.30 line.
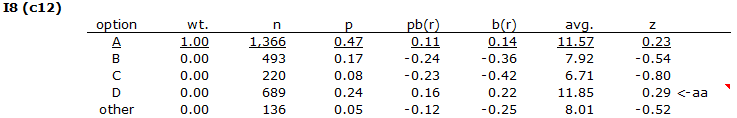
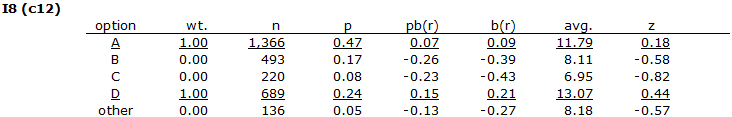
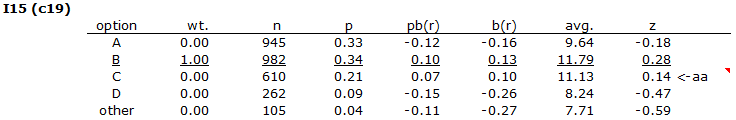
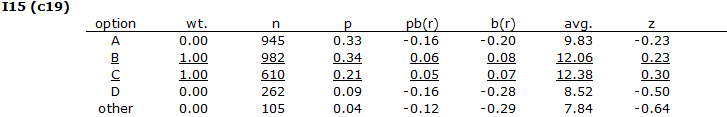
The bottom table above shows I8 after double-keying. Note how the "avg." and the "z" values have dramatically increased for the 689 students who selected option D? I15's changes show a similar pattern, but are not as dramatic:
As a teacher I usually love it when students ask questions, providing I know the answer. So it is that I am now pleased when Andrés Ricardo, sitting in the back as always, comes forth with a really good question:
"Why have the scatterplots shown I8 moving to a discrimination above 0.30 when its pb(r) values are nowhere near that?"
Well, the pb(r) values are correct, but, when an item is multiply-keyed they're not the appropriate measure of item discrimination. We'd want the correlation of the item with the criterion score, not the correlations of the options with the criterion. Such correlations are given in the Statsb reports, under its "disc." column.
No-one asked, but I was ready to make a similar comment about item difficulty. When an item has just one right answer, the corresponding p value in Statsf will equal "diff." in Statsb. Otherwise, when items have more than one keyed answer, their difficulty index is shown in Statsb under the "diff." column. (For more about item difficulty calculations, click here.)
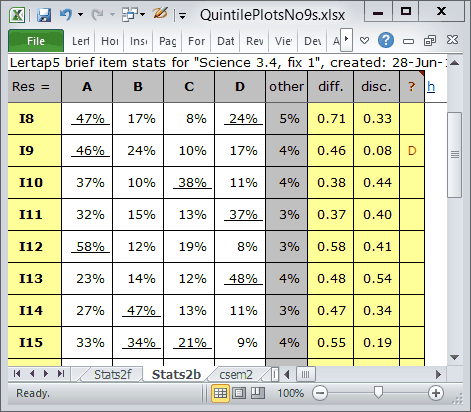
In this table (above) we see that I8 has a discrimination ("disc.") of 0.33. I15's disc. value is 0.19.
"Why does I9 have a D in the ? column. What is the ? column?"
Flags! I have forgotten to mention flags. Look here, please:
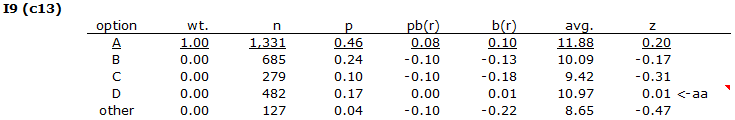
See the "<-aa" indicator, with a little red triangle? It's a flag, something to draw attention to an item option which may have a problem. In the Statsb reports, the "flags" appear in the ? column, but they're not triangles.
"aa" means "above-average"; the "avg." score of the 482 students who chose option D on I9 was above the overall test score average. Lertap has had its flag waver out to signal this. Why? Oh come on. You gotta know by now: an item meant to discriminate should have what? One option with a high "avg." value, just one, and only one "z" with a positive value. So out comes the flagger on I9, saying "look here, possible rule violation, potential penalty, for I9". (Read more about flags here.)
I have a question for you now. How do you think the quintile plots will have changed for I8 and I15?
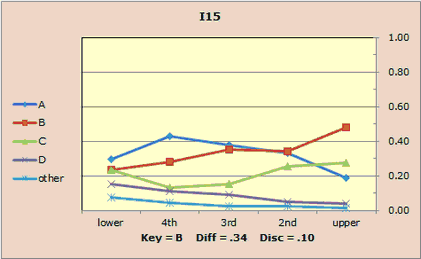
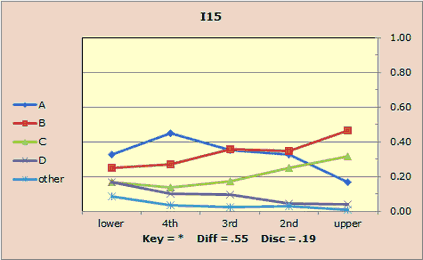
Get your hopes down. We won't notice a great deal. Here are before (on the left) and after (on the right) pictures:
|
|
|
|
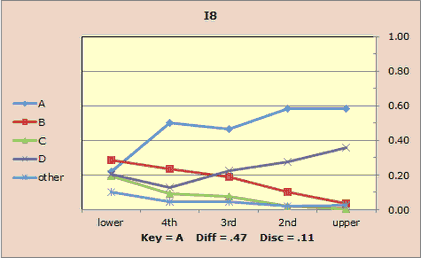
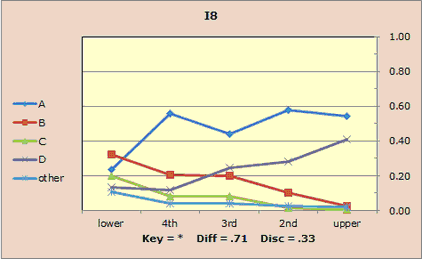
There is a need to combine the two right answers for these items so that we end up with a single line combining the proportions in each group. Imagine I did this for the upper group in I8. The correct answers are A and D. It looks like A's proportion is about 0.55 in the upper group, with D's about 0.40. Combining these gives 0.95 for what would be our new trace line for the correct answers combined. This would then make a nice quintile: the trace line for the right answer would flair up on the right, almost reaching 1.00 (or 100%); the other lines would not change.
The effect of combining the two right answers for I15 would not be quite as impressive. It looks like for the upper group I'd be combining about 0.45 (for option B), and maybe 0.31 (for option C), giving 0.76. Nice, an improvement, but not as compelling as the change for I8. (The big problem for I15 is that distractor A has not fallen to zero, or near zero, in the upper group. Distractor D is near zero, but still hanging in a bit.)
What then may we conclude about the effects of double-keying two items, I8 and I15? Well, the real effect has gone unmentioned, hasn't it? We have made our test scoring fairer. After acknowledging ambiguities in these two items, and double-keying them, we've changed the marks for the 689 students who took option D on I8, giving them an extra point. In a similar manner, the 610 students who selected option C on I15 also now have an extra point.
Summary. In this topic I've discussed how item and test performance have changed after two items were double-keyed. The discrimination value for both items has gone up, as has test reliability. But it certainly bears repeating, let me say it once more: these items need to be fixed before they are used again.