MDO for cognitive tests (Statsf)

Contents
There's a control word, "MDO", which may be used on the *sub card to control how Lertap processes missing data. MDO may be used with both types of test, cognitive and affective. The letters stand for "missing data out", meaning that records with missing data are to be excluded from Lertap's various calculations.
This topic discusses the effect of the MDO and did-not-see options on the cognitive test reports produced by Lertap; a following topic does likewise for affective tests.
Look at these CCs lines for a cognitive test:
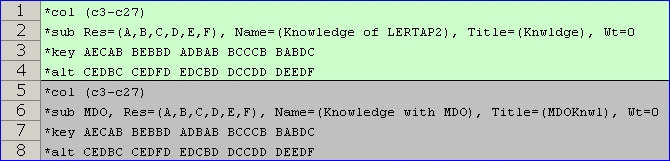
These eight "cards" involve the same 25 items. Being the avid reader you are, you know you've seen these items before -- they're from the Lertap quiz.
The cards define two subtests. The only difference between the two is that the second one has the MDO option on; you can see it on the 6th line.
Statsf reports
A squiz of the Lertap's Stats1f and Stats2f reports will serve to highlight the effect of using MDO:
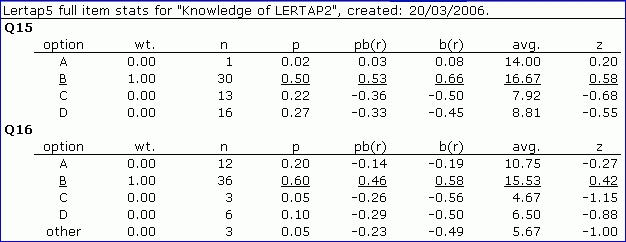
The report above comes from Stats1f. It summarizes the performance of two items, Q15 and Q16, using a variety of statistics.
Both items use four options, employing response codes {A,B,C,D}.
A student selecting option B will get 1.00 points towards her/his test score, as seen under the wt. column -- we'd conclude that both items have just one correct answer as all the other wt. values are zilch (zero).
Thirty (30) students got Q15 right. Sixty (60) students were involved, so p for Q15's option B is 0.50, which is, of course, 30 divided by 60.
The pb(r) and b(r) columns are, respectively, point-biserial and biserial correlation coefficients, indexing the relationship between option selection and the criterion score. If the item forms part of the criterion, as it does in this case, Lertap applies a part-whole correction, taking out the inflation the correlation coefficients would otherwise have (see the manual for a more extensive discussion).
The avg. column shows the average criterion score for those students selecting each item option. On Q16, the 36 students who selected option B had average criterion scores of 15.53. As a z-score, 15.53 is 0.42 (the manual has more to say; you ought to read it some day, perhaps when next at the beach).
Note that Q16 has an "other" line. Three students had missing data for Q16. They were weak students; their avg. was low, as it was for those who chose distractors C and D.
Okay? Got it? Good; now have a peep at the stats for the same two items after the MDO option has been used:
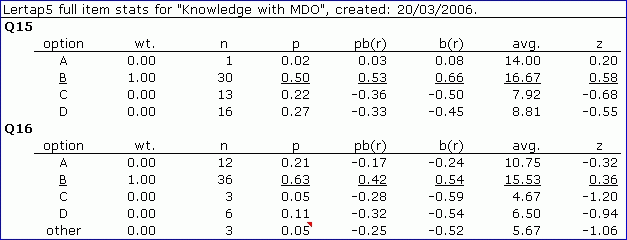
There's no change in the stats for Q15; all 60 students answered that item. But Q16 has changed; many of Q16's stats above, from p through z, differ from the Q16 stats seen earlier. Why? Because the three students missing an answer to Q16 have been excluded from the calculation of the stats.
Look at the p column, for example. For Q16's option B, p is now 0.63, corresponding to 36 divided by 57, not 36 divided by 60.
The avg. values are now computed using just the criterion scores for the 57 students who answered Q16. This applies to the other line too: 5.67, as a z-score in the distribution of 57 scores, would be -1.06.
Now, take a few seconds and sum down the p column for Q16. In the first report above the sum is 1.00 (100%). But in the second report the sum comes to 1.05 (105%). What's up?
The 0.05 p value for Q16's "other" row is just indicating the proportion of respondents who did not answer the question. The other four p values for Q16 sum to 1.00, which is what is expected when the MDO option is in use.
Statsf reports and the did-not-see option
When you've got the did-not-see option going, the Statsf report will be quite similar to what you've just seen immediately above. Look:
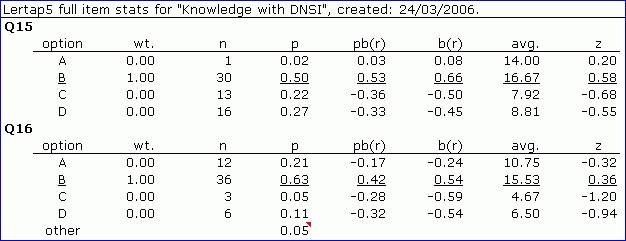
There's just a wee difference in these results. Can you spot it? The other line is now missing most of its stats.
What about the joint operation of MDO and did-not-see. What happens then? Got time to look at results for two items delivered to 421 students over the internet, using the Test Pilot system from McGraw-Hill?
In this example, a blank was used as the did-not-see code, and 9 as the code for missing data.
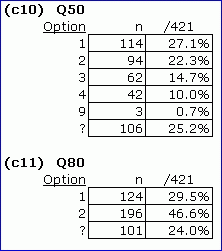
On Q50, three students failed to provide an answer, while 106 students did not see it (Test Pilot presented Q50 to 315 of the 421 students). Q80 was presented to 320 students, and they all answered it. Look at the corresponding Statsf summaries:
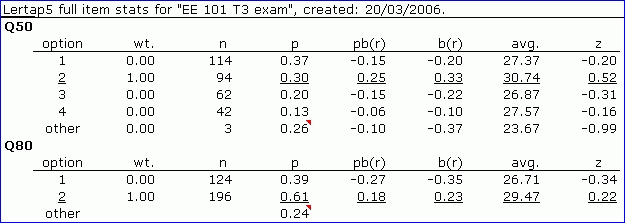
The statistics for both Q50 and Q80 have been computed by excluding the students who did not see the items, and by also excluding those with missing data.
Were you to sum the p values for Q50's four options, you'd have 0.37 + 0.30 + 0.20 + 0.13, or 1.00 (100%). The 0.26 on Q50's other line is the proportion of students who did not have an answer for the item, either because they did not see the item, or saw the item but did not answer it.
Let your mouse hover over the 0.26 value, and behold:
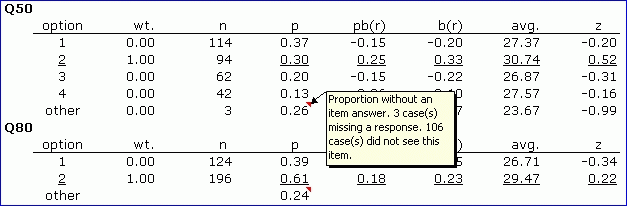
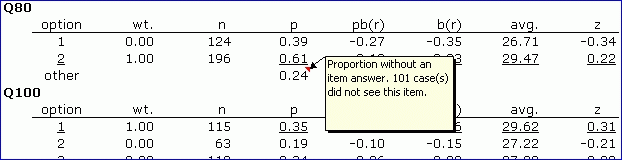
See how it works? When Lertap is running with both options, did-not-see and MDO, then the other line will have stats only when there were some students who did not answer the item. For Q50, the avg. criterion score for the three students who were missing data was 23.67; when this avg. score is inserted into the distribution of criterion scores for those 312 students who did answer the item, the corresponding z-score is -0.99.
Related tidbit:
As discussed in the manual, when more than one option to a cognitive item has a non-zero "wt." value, the pb(r) and b(r) statistics are corrected for part-whole inflation only for the option having the greatest wt.