Full statistics (affective)

Contents
Lertap’s “full” report for affective tests has two main areas, starting with item-level results, followed by various subtest summary sections.
The item results look like this:
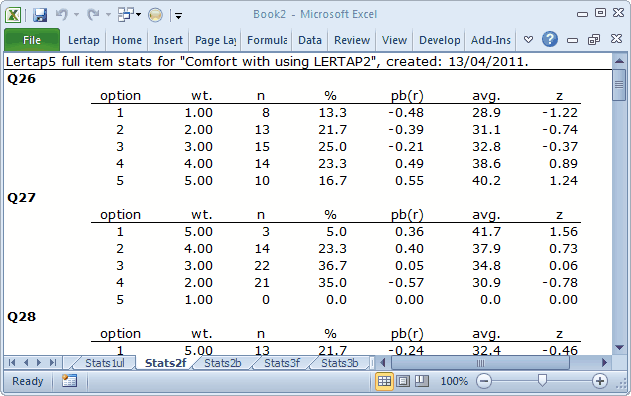
The full statistics for affective items are quite similar to those provided for cognitive items.
Users can check Lertap’s item scoring by looking down the “wt.” column. Here, “wt.” means weight. Above Q26’s weights exhibit “forward” scoring, while Q27’s are reversed—do you see why?
On Q26, a response of 1 (the first option) has a corresponding weight of 1.00, and 5 has a weight of 5.00. These “weights” are what people get for their answers. They’re item scores. Someone who answers 1 on Q26 will get 1.00 points. However, the scoring has been reversed for Q27. An answer of 1 on Q27 equates to 5.00 points. This forward (+) and reverse (-) scoring is defined on the subtest’s *pol card in the CCs worksheet.
The pb(r) column gives the point-biserial correlation of each option with the criterion score, that is, the subtest score. At this level, the pb(r) figure is not corrected for part-whole inflation—it is for cognitive items, but not for affective ones, and this subtest, Comfort, is affective.
The “avg.” column indicates the average criterion score for the people who selected each option. On Q26, eight (8) people selected the first option, and their average criterion score was 28.9, or, as a z-score, -1.22.
The criterion score in use at the moment is said to be an “internal” criterion: it’s the subtest score itself. Thus the z-score for Option 1, Q26, is computed by subtracting the subtest mean, 34.5, from 28.9, and dividing the result by the subtest’s standard deviation, 4.6.
Weights for missing affective responses
There were no “other” responses for the two items shown above, Q26 and Q27. Every one of the 60 respondents answered these two items by selecting one of the five options. However, on Q28 two people declined to respond—their “answers” were entered as a “blank” (a space) in the Data worksheet. The statistics corresponding to these two are seen below in the “other” row:
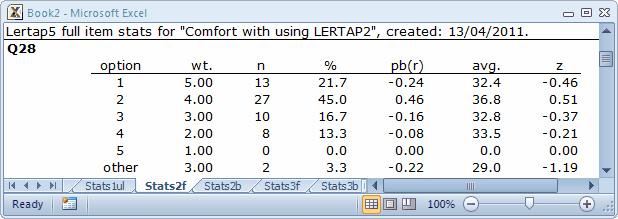
It is important to note that Lertap gives a score to “others”. In this example, the score for “others” is 3.00 points, which is the middle of the weights for the item.
The reason Lertap assigns a weight, or score, for “others” is to try and keep the response summaries “honest”. If “others” got no weight, as is the case for cognitive items, then the item mean would be lowered, and, if users just looked at results in the brief stats sheet, Stats2b, a false impression of item responses might occur—one would have the impression that responses were lower than they actually were.
Assigning a scoring weight to “others” is done automatically, and is referred to in Lertap as the MDO, the missing-data option. This automatic assignment may be turned off by using the MDO control word on the *sub card, as exemplified here:
*sub Aff, MDO, Name=(Comfort with using LERTAP2), Title=(Comfort), Wt=0
Users of previous versions of Lertap will notice that the way MDO works in this version is opposite to what was before. Now MDO is always assumed to be “on”, and the MDO control word on the *sub card extinguishes it. Read more MDO to be in the know.
The item-level information in the Stats2f sheet is followed by a series of summaries, as shown here:
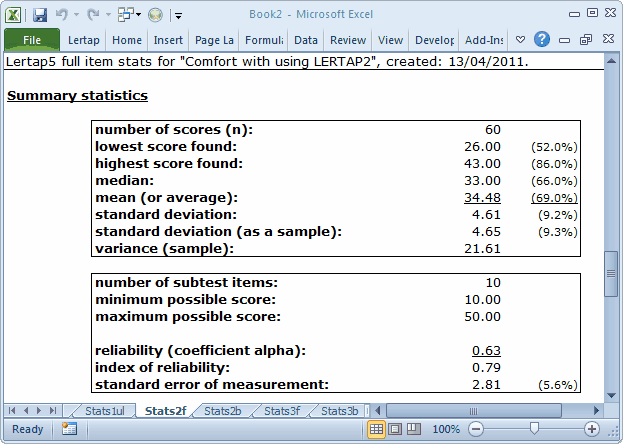
In the Summary Statistics section, the % figures convert the various summary indices to their percent counterparts, where the percentage values are based on the maximum possible score. Thus, for example, the lowest score found in this group of 60 was 26.00, which is 52% of the maximum possible score, 50.00.
The minimum and maximum possible scores are determined by going over the items, one by one, summing the lowest weights to get the minimum possible total score, and summing the highest weights to get the maximum possible.
The reliability figure reported by Lertap is coefficient alpha, an internal consistency figure sometimes called “Cronbach’s alpha”.
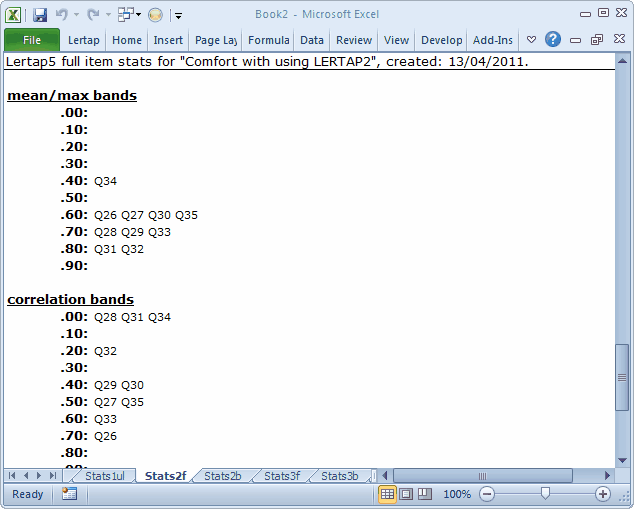
The mean/max bands are based on dividing each item’s mean by the highest item weight. For example, the Stats2b sheet indicates that Q26’s mean was 3.08. The highest weight for Q26 was 5.00, so the item’s mean/max figure was 0.62—this is why Q26 may be seen lying in the 0.60 mean/max band above. These bands make it possible to quickly see where responses were most polarised. In this example, respondents were particularly in agreement on items Q31 and Q32. Of course, a scan down the means column in the Stats2b report will indicate the same (these items have the highest means), but when there are many items the mean/max bands capture the results more efficiently.
The correlation bands simply map the results of the Stats2b “cor.” column, making it possible to rapidly identify those items with the greatest correlation with the criterion score.
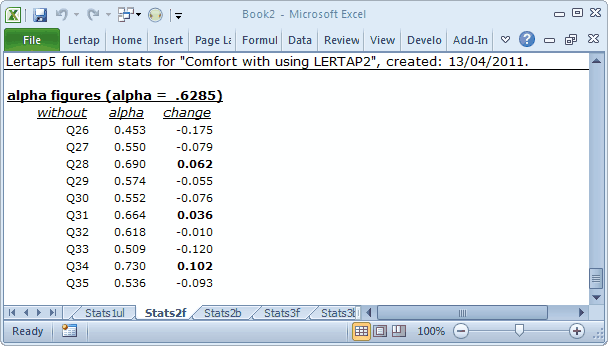
The alpha figures indicate how subtest reliability would be affected should an item be removed from the subtest. For example, without Q26 alpha would decrease by –0.175. Note that we’d get quite a nice increase in reliability if Q34 were omitted from the subtest. However, whether or not we’d actually want to delete an item from the subtest does not usually depend on reliability alone. There are times when the information pertaining to an item is of great interest, and reliability, at times, is not a major focus. Another topic in this document, the CEQ survey, has a collection of survey items with low reliability. The CEQ researcher based her interpretation of survey results only on the item statistics, ignoring reliability.
Coming to the end of the Cook's Tour.