Brief statistics (cognitive)

Contents
Have a look at the Stats1b worksheet, top and bottom:
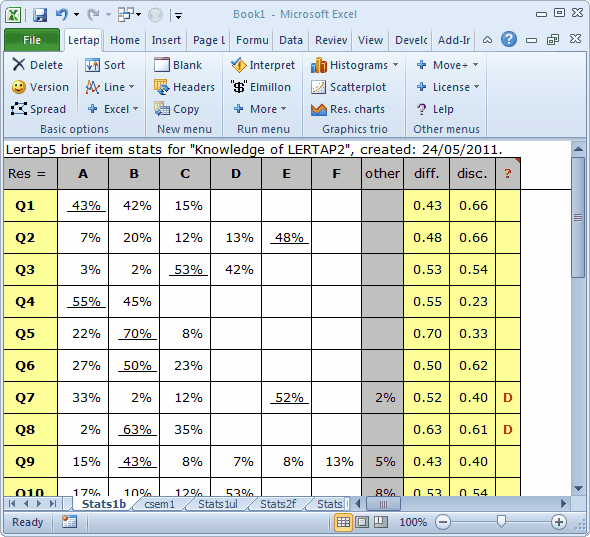
This sheet has its row and column headers hidden, but the contents of the first row are obvious: a header, a title. Note that it includes the name of the subtest, as given in the corresponding *sub line in the CCs worksheet.
The second row in Stats1b displays the responses used by this subtest, from A through F. The “other” column is used to indicate how many weird responses were found for each item (that is, "responses" which do not correspond to an item's options, including non responses and data processing errors). Going to the right, “diff.” means item difficulty, and “disc.” means item discrimination. The ? column is used to indicate which, if any, of the item’s options might be regarded as rendering questionable service. Read much more about the ? column in an earlier topic, "MathsQuiz".
You’ll note that each item’s summary statistics are presented in a single row. The percentage figure which is underlined corresponds to the item’s correct answer, as taken from the corresponding *key line in the CCs sheet.
The derivation and interpretation of the diff. and disc. columns is discussed in following topics. The information in the Stats1f sheet is actually taken from lines found in another of the three statistical summaries, the “full stats” sheet, Stats1f.
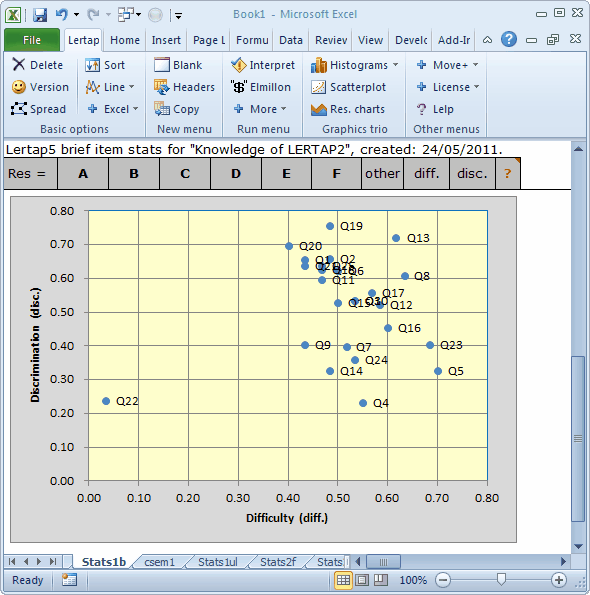
The scatterplot found at the bottom of Stats1b is based on the Diff. and Disc. columns. The interpretation of such scatterplots is discussed in numerous other topics, particularly "M.Nursing". In this case, the scatterplot is quite a good one. Only two items, Q22 and Q4, have discrimination figures below 0.30. Q22 had a diff. value of just 0.03, meaning that it's a difficult item, correctly answered by only 3%. Otherwise, the diff. values are good.
(Note that in making these comments about item disc. and diff., we're assuming that we want to have a discriminating test, one meant to identify the strong and the weak students. This isn't always the case at all. At times all we want to do is see how a class did on the items, looking for items which may have been particularly difficult, information which we could then use to review course content with the whole class.)