Group DIFferences

Contents
"DIF", differential item functioning, refers to procedures used to determine whether or not test items may have unexpectedly favored one test-taking group over another.
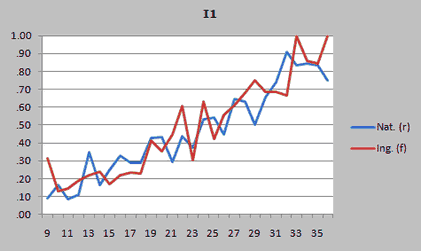
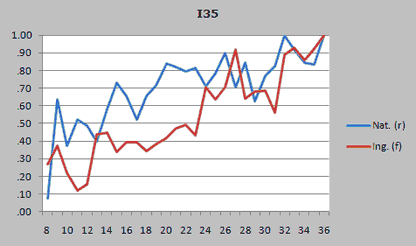
The plot above indicates the proportion of students with test scores ranging from 9 to 36 who got "I1" right. The plot shows that for all those with a test score of 9, 31% of the students in the "Ing." group got the item right, compared to 9% in the "Nat." group. However, over the range of scores plotted, there is not a consistent pattern: one group will be on top at a particular score level, but then the other group will be on top at another score level. This plot (and its associated statistics) is an example where no DIF was detected. The plot below differs: it shows some evidence of DIF as the Nat. group rather consistently outperformed the Ing. group, especially at score levels from 14 to 23.
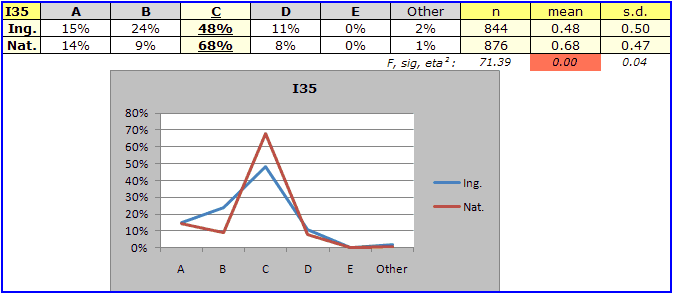
Lertap 5 uses the Mantel-Haenszel method for assessing DIF. A technical paper on this is available, as are related topics in "Lelp", Lertap help. There are many times when test developers and users are not necessarily concerned with DIF, per se, but want to have plots which trace the performance of item responses in order to discern how groups may have differed in their "endorsements" to each of an item's options. For example, the table below, and its corresponding graph, indicate that many of the 844 students in the "Ing." group were distracted by option B: 24% endorsed B, compared to just 9% in the "Nat." group. This almost certainly accounts for the considerable group disparity seen at option C, which was the correct answer to I35.
Tables and plots such as the one above are discussed in another Lelp topic. |