Uni Class A (looking for possible cheating)

Contents
This example is from a large North American university. It's based on a 30-item multiple-choice test taken by 127 students and will be used to exemplify the application of Lertap's response similarity analysis capability, RSA, to see if there might be some suggested evidence of possible cheating.
The original data are found in one of the sample files distributed with Wesolowsky's SCheck program; SCheck is short for "Similarity Checker".
A link to a "csv" (comma-separated values) file with original item responses is here; a snapshot of some of the lines in this file is shown below:
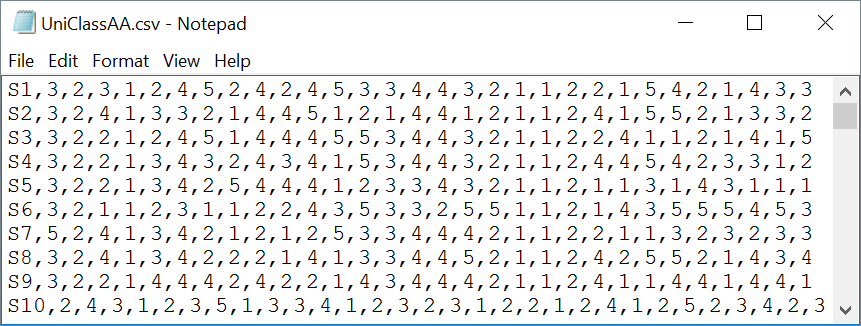
OMR (optical mark recognition) scanners for processing student answers on "bubble sheets" commonly output csv files. These files are Excel friendly; Excel will readily open a csv file, no questions asked.
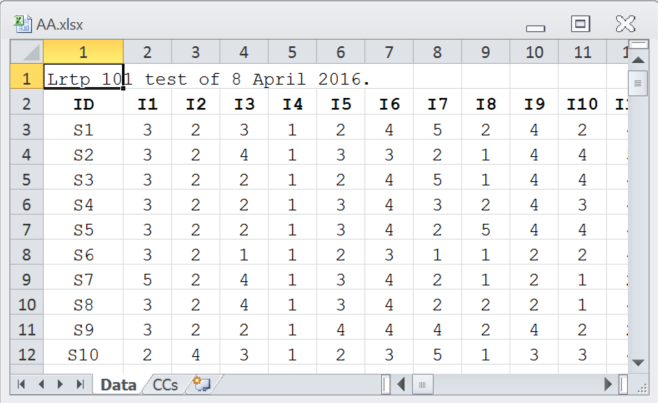
Importing csv files so that they're ready for Lertap is a process described in this topic. The following two snapshots display the Data and CCs worksheets set up for use in the format expected when working with Lertap 5.
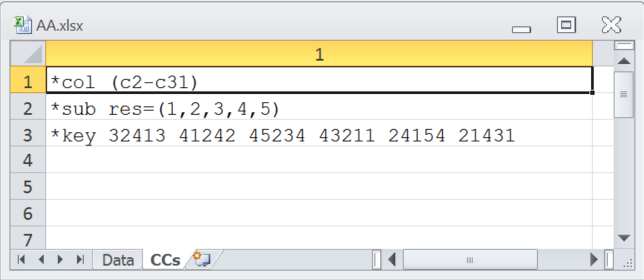
The *col line indicates that item responses start in "c2" of the Data worksheet and end in "c31" -- short for column 2 and column 31. The *sub line's res= statement tells Lertap that valid item responses for this test's items were 1,2,3,4,5, and the *key line gives the correct answer for each of the 30 items; the correct answer for the first item was 3, for the second item it was 2, and so on. More about CCs lines is here.
Ready for results? Play along if you'd like: download a copy of the dataset and run it with Lertap 5 (see this topic for how to get Lertap 5).
2) Use the Interpret option on the Lertap tab.
3) Use the Elmillon option on the Lertap tab. |
|
As the Interpret option went about its work, it flashed up this message:
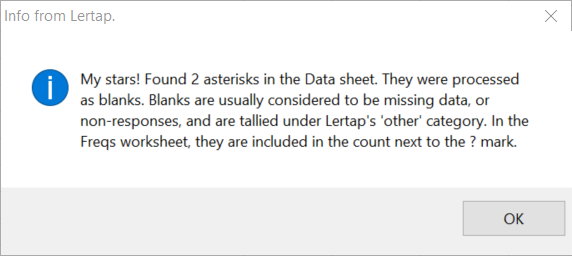
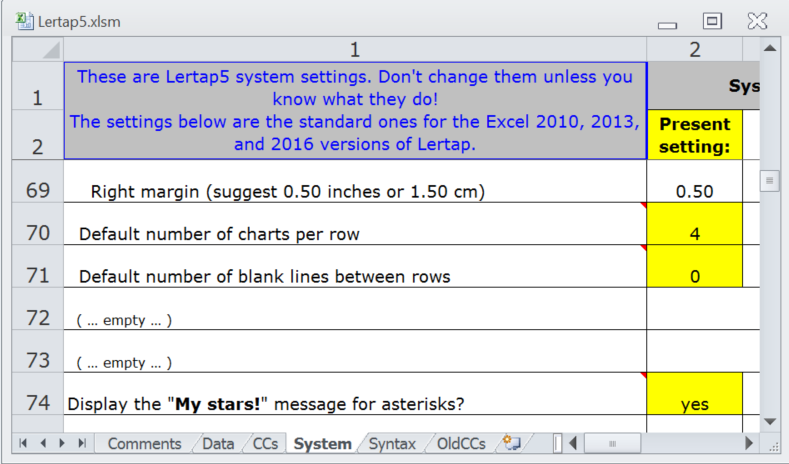
OMR scanners will sometimes record an asterisk as a student response when a student has shaded in more than one bubble on his/her bubble sheet. It's possible to ask Lertap to ignore asterisks by using a setting in line 74 of the System worksheet:
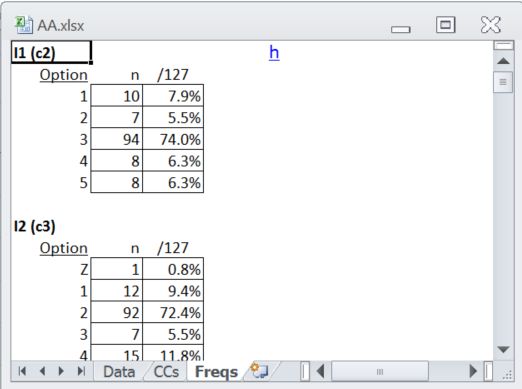
In the case of this little test, Interpret's Freqs report was pretty clean:
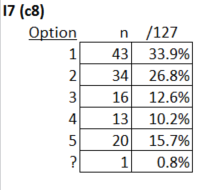
The number of Zs was very low, and there were very few items with a ? entry; the seventh item was one of just two items with a ? mark tally, indicating that one student apparently did not answer the item:
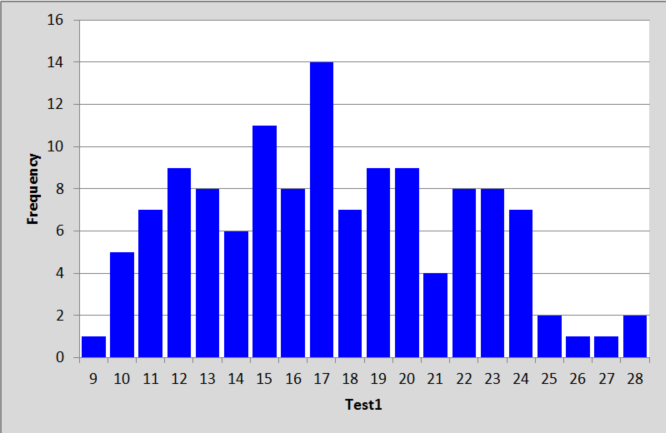
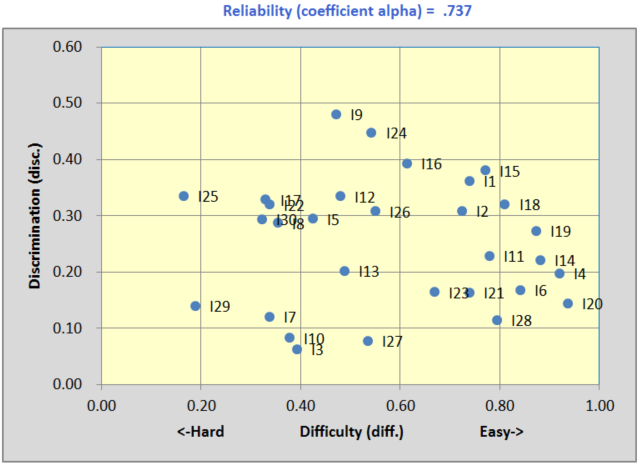
A histogram of the test scores produced by the Elmillon option showed no irregularities:
The scatterplot at the bottom of the Stats1b report revealed three items, I3, I10, and I27 with discrimination below 0.10:
A scan down the Stats1f report revealed a number of items with distractors (incorrect answers) selected by above-average students. Item 27 was one of them:
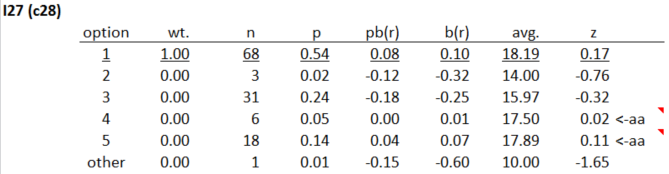
The correct answer to this item was 1; 54% (n=68) of the students selected it. However, some fairly strong students, ones with above-average test scores, thought that distractors 4 and 5 were plausible answers. The 18 students who selected option 5, for example, were fairly capable students judged by their average test score of 17.89 (the mean of all test scores was 17.41, equal to 58%). There may have been some ambiguity in the item, something which might have caused some students to read the item in a manner different to that expected by the instructor.
As a result of items such as I27, coefficient alpha's value was on the low side -- we'd usually want to see a value of 0.80 or better, but multiple-choice tests made by lone instructors will often turn in relatively weak alpha values.
What to conclude thus far? Well, the data look clean, there aren't many unexpected "responses" -- a couple of Zs (for some reason), and an asterisk or two, nothing alarming. The score distribution seems reasonable, ranging from 9 to 28 with an average of just over 17, or 58% of the maximum possible score of 30.
Test reliability, as indexed by coefficient alpha, was on the low side. Some items, such as I27, may have had some ambiguity for the students, and the instructor might want to review them before the items are used again.
Let's move on now to running Lertap's RSA routine, a tool which can be used (when conditions are suitable) as a check on possible cheating, or "collusion".
Please page forward.
Tidbit:
Note the "when conditions are suitable" qualifier used in the text above. The RSA method used in Lertap works best when a test has at least 30 items and an average test score less than 80%. In personal correspondence (22 April 2016), Wesolowsky has stated that the method is "ok" when the number of questions is "around 50". He has found the method to underestimate similarity when there are "100 questions or so", and to overestimate when "there is a small number of questions".