Stats1f reports

Contents
"Stats1f" means full statistics, the big shebang. If the CCs worksheet refers to more than one subtest, as is the case with the CooksTour sample, there will be one "f" report for each subtest. Their names will be Stats1f, for the first subtest, Stats2f for the second, and so on.
A Stats1f report is a long one. It has complete, or "full", item statistics at the top, reliability information in the middle, and then some handy summary info towards the bottom.
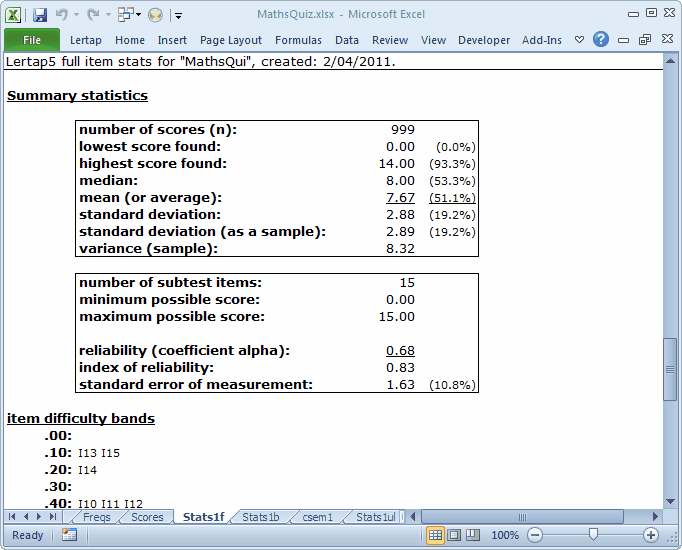
When Lertap creates a Stats1f report, it automatically scrolls to the middle section, where the reliability (coefficient alpha) figure is found:
A test meant to discriminate, to pick out the strongest students, should have good reliability.
Lertap uses Cronbach's coefficient alpha index for its reliability figure; for details, refer to Chapter 7 of the Lertap manual.
This little test does not have good reliability. A figure of 0.68 is lousy if we want a test which discriminates.
Keep in mind that there will be times when Lertap users do not care to look at Stats1f results. The ChemQuiz sample is an example. There are certainly times when teachers, and others, can, and do, make do with just the Stats1b report.
But in this case Discrimination R Us. We have a quiz whose purpose is to help teachers identify not just the strong students, but also the weak ones, perhaps with the goal of taking the poor performers into a special class session or two for some make-up work.
To do this we'd like a test with a reliability of 1.00. And, while we're at it, why don't we go for a new car, plus a first-class, around-the-world ticket on the Queen Mary? All of these are unlikely events. If we can get a test with an alpha reliability of 0.90 we're doing well; 0.95 is not unheard of, but not common.
For a 15-item quiz, many might be happy with an alpha of 0.80 or thereabouts. This is a short test, and short tests usually struggle to get into the really high reliability area (say, greater than 0.90). But 0.68 for a test meant to discriminate? Nope.
So now we ask if there might be something wrong with some of the 15 items. And yes, there is. That ? column in the Stats1b report dobbed in three items: I11, I14, and I15.
Scroll the Stats1f report up to get the full stats for I11:
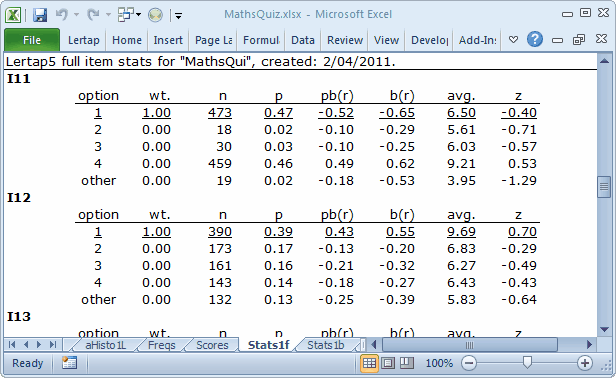
The screen snapshot above is a picture of Lertap's full item stats. Complete details on interpreting these statistics are in that Chapter 7 mentioned above; there's also a bit about them right here, in this document.
What's wrong with I11 is that the 473 students who selected the first option, the keyed-correct option, had an average test score of 6.50, which was below the overall test average of 7.67. I11's pb(r) value is -0.52, which is "way bad". You can see this "way-badness" in the little scatterplot at the base of the Stats1b report, shown in the previous topic. I11's blip in the scatterplot is far removed from the others.
This item was mis-keyed. The correct answer was 4, not 1.
Have a gander at the statistics for I11's option 4: it was selected by 459 students with an average test score of 9.21. These were strong students.
Looking down the "avg." column, what we'd like to see for a discriminating item is that the highest value is underlined, meaning that those students who got the correct answer (underlined) were the strongest. We'd also want to look the z column in the eye, and find all but one of the z's negative in value; this would mean that the people who took the distractors had average test scores below the mean (that is, below the overall test average, in this case 7.67), while those who got the item right had above average test scores. I12 is a good example of the patterns we want to see. (Note that 132 students didn't answer I12, representing 13% of the test takers. This figure is high. Also note that their average test score of 5.83 was the weakest of the lot for I12; the implication here is that a fair portion of the weaker students were unwilling to even take a guess on this item.)
What about I14 and I15, two other items flagged in the ? column in Stats1b? Stats1f says this:
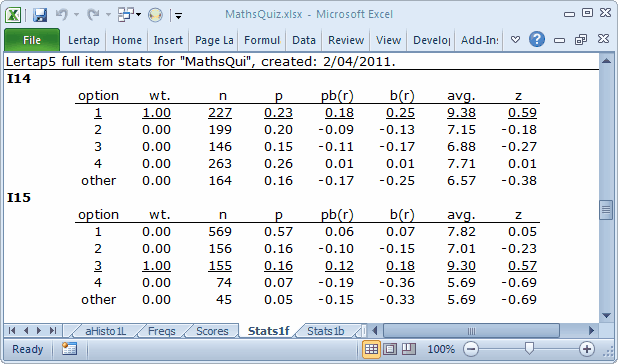
What's happened here is that each of these items has a distractor selected by students whose average test scores were above the test mean of 7.67. In the case of I14, it's option 4. For I15 it's option 1.
These are undesirable outcomes; these two items were difficult for the students -- that's not bad at all, but the fact some capable (that is, above average) students opted for a distractor would indicate a good reason to review these items. There may well be some ambiguity in the items, a bit of wording, perhaps, abundantly clear in the item writer's head, but confusing to the students. Often a good way to uncover ambiguity of this sort is to ask the students why they thought the distractor was the best answer.
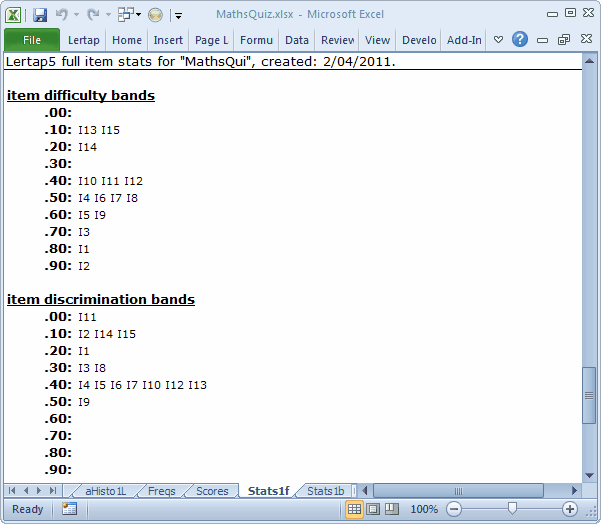
If you thought you heard music playing whilst looking at Stats1f, no doubt it was from the bands found towards the bottom of the report.
The information in these two bands is very similar to the information provided in the scatterplot at the bottom of Stats1b.
I13 and I15 had difficulties between 0.10 and 0.19. Two items, I1 and I2, were easy, having difficulties at or above 0.80.
I9 had the highest discrimination figure. I11 had the lowest, but there's a problem here: the discrimination bands are incapable of hitting really low notes. I11's discrimination figure was -0.52. This is a truly low figure. The little band shown above does not indicate exactly how low I11 dipped. In this regard, the scatterplot found at the base of the Stats1b report is better -- when item discriminations go negative, the scatterplot will so indicate -- but the Stats1f band will not.
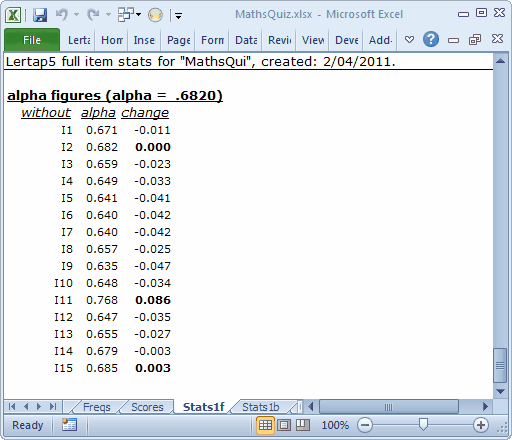
Finally, at the bottom of the bottom of Stats1f reports, there's a wee table which shows what would happen to the test's alpha figure if an item were to be totally removed from the test.
Here we start with an incoming total-test alpha of .6820. Take out the first item, I1, and alpha would fall to 0.671 (so, we wouldn't want to take out I1).
Take out I11, on the other hand, and alpha goes up to 0.768. Any item with a positive value in the "change" column would be one we might want to re-examine. Why? Because a positive change means that alpha would actually increase if the item were excluded from the test.
Summary remarks
The reliability figure for this administration of the test is considerably lower than what would be desired. In large part this is due to one item, I11, being incorrectly keyed. Were we to put in the correct key for this item, changing the 11th entry in the *key line on the CCs worksheet from 1 to 4, coefficient alpha would get a nice boost, a bit more than the 0.768 figure just mentioned. We leave it to you to confirm this: page ahead to the download topic, get a copy of the workbook, make the change in the *key line, and see what happens.
The matter of having two items, I14 and I15, with distractors selected by above-average students might be a cause of some concern. It could be suggested that the students who selected these options have been disadvantaged, maybe even "penalized". We'd be tempted to think this if, on reviewing the items and maybe speaking with students, it became apparent that the distractors could well be seen as correct answers. We could use an *mws line to double-key each of these items, an action which will tell Excel that these items have two correct answers. For each of these "correct answers" we will give one point:
*col (c2-c16) |
*sub res=(1,2,3,4), title=(MathsQuiz) |
*key 34142 13234 11413 |
*mws c15, 1, 0, 0, 1 |
*mws c16, 1, 0, 1, 0 |
The first *mws line refers to the item found in column 15 (c15) of the Data worksheet, which is I14. It says give one point for the first and fourth options, zero points for the second and third options. For I15, located in c16 of the Data worksheet, the second *mws line will give one point to those who selected the first option, zero points to those going for the second option, one point for the third option, and zero points for the last option.
These changes will impact the test scores, and they might very well also affect coefficient alpha. How? See for yourself: page ahead to the download topic, get a copy of the workbook, add the *mws lines, and see what results.
Finally, a suggestion: the following CCs lines add a new subtest, making it possible to retain the original reports. If you try these lines, you'll see that the Scores worksheet will include three columns, one for MathsQui, one for MathsQ2, and a new one, Total. Don't want the Total? Change each *sub line so that there's Wt=0 at the end. For example: *sub res=(1,2,3,4), title=(MathsQuiz), Wt=0
*col (c2-c16) |
*sub res=(1,2,3,4), title=(MathsQuiz) |
*key 34142 13234 11413 |
*col (c2-c16) |
*sub res=(1,2,3,4), title=(MathsQ2) |
*key 34142 13234 41413 |
*mws c15, 1, 0, 0, 1 |
*mws c16, 1, 0, 1, 0 |
Tidbits:
The matter of improving coefficient alpha by eliminating test items is further discussed in a Lertap erudite epistle. It's the "Coefficient alpha, eigenvalues, scree tests" paper. Download this PDF technical marvel. Read about Lertap and eigenvalues here.
There's much more about *mws in the manual, and here (see Example C10 and following discussion).