Did-not-see option

Contents
Options in the System worksheet allow users to adjust cognitive item statistics so that they are based only on those cases (students) that had a chance to answer the item.
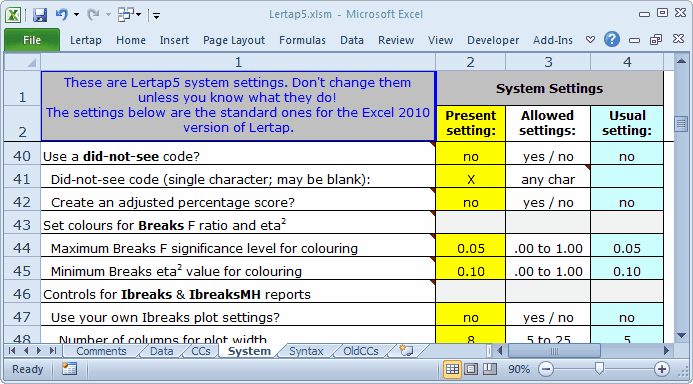
The did-not-see option is activated by placing "yes" in column 2 of the appropriate row in the System worksheet; in the example above, this is row 40.
Use of this option requires a corresponding did-not-see code, a single character recorded in the Data worksheet whenever a student did not have the chance to answer an item (for whatever reason). In the example above, the code is a blank. The code may be any single character, including a blank, an upper-case letter from the Latin alphabet (ABC...XYZ), a lower-case letter (abc...xyz), or a single Arabic numeral (0123456789).
How does Lertap process item responses with this new option? Well, for any item, Lertap first looks to see if a student's response corresponds to one of the response codes used by the item's options. If it does not, then Lertap looks to see if the "response" matches the did-not-see code, assuming the did-not-see option has been activated. If it does not, then the response is classed as "other", a response category often referred to in Lertap documentation as "missing data".
Lertap will automatically adjust all of its item statistics so that they exclude did-not-see cases (that is, of course, assuming the did-not-see option has been activated—if the option has not been activated, then what would have been a did-not-see response will be included in the "other" response category, and processed as missing data).
Use the Freqs worksheet to check on missing data and did-not-see cases, and note: if the did-not-see code is a blank, Freqs will include did-not-see cases in its "other" line.
To see what the various "Stats" reports look like when the did-not-see option is on, just page forward to the following topics.
Scoring
Whenever the did-not-see option is in effect, users have the option to have Lertap calculate two scores for every person on each subtest defined in the CCs worksheet: the usual subtest score, and a percentage score which is based on the maximum possible score which could have been obtained on the items actually presented.
The first score, the "usual" subtest score, will be the number of points earned on the number of items the person had the opportunity to answer. In the cognitive case, the most common scoring method is to give one point for each correct answer—in this case, the "first score" will simply be the number of items right.
The second score is only produced when "yes" is found in the System worksheet in the second column of the line which says "Create an adjusted percentage score?". This score is formed by dividing the first score, the "usual" subtest score, by the maximum possible score which the person could have had if s/he had correctly answered every presented item; this figure is then multiplied by 100 to get a percentage index.
Coming back to the common cognitive case, with one point for each correct answer, the second score is the number of answers right divided by the number of items presented, multiplied by 100.
Note that both of these scores exclude items which the person did not see, that is, did not have the opportunity to answer.
It is not necessary to use the PER control word on the *sub card in order to get the second score: it's computed automatically, providing "yes" is found in the second column of the line which says "Create an adjusted percentage score?".
Adjusted?
When would you want to have the percentage scores "adjusted"? What does "adjusted" mean, anyway?
Well, it turns out that certain online test generators can create tests of variable length; some students might see a 48-item test, others a 45-item test, and still others a 50-item test. A student's test score will depend on the number of items s/he had the chance to answer. Two students with the same "usual" subtest score, say 35, will not have the same percentage score if they have been presented with a different number of items.
For example, if Jorge got a score of 35 on a test with 50 items, his percentage score would be 70%, assuming one point for each correct item. Suppose it turned out that Marisol also got a score of 35, but she was presented with only 45 items; her rounded percentage score will be 78%.
When you've asked Lertap to "Create an adjusted percentage score", the percentage test score will be adjusted according to the items a student actually saw.
If all students get the same number of items, there is no need to create an adjusted percentage score. Ah, but wait a minute! We should adjust this comment: if all students are presented with the same number of items, an adjustment is not required if all items are scored the same way. When items are scored in different ways, then the adjustment might again be useful. For example, if Item 26 is worth one point, but Item 27 is worth two points, then we might well want to make an appropriate adjustment to scores, depending not only on how many items a student saw, but also on the number of points the items are worth.
Lertap creates the adjusted score by dividing the "usual" subtest score by the actual maximum possible score a student could have achieved, based on the items presented to the student.
Sample Scores output
As you page forward to following topics, you'll come across an example from an actual online testing situation, one which used the Test Pilot system from McGraw-Hill.
Over 400 students at a large North American university took an online version of a test delivered by Test Pilot. Sampling from a pool of 80 cognitive multiple-choice items, Test Pilot served up tests whose lengths varied: some students were presented with 40 items, some with 43, some 45, and others 48. (Please read the second "tidbit" below -- the situation was actually a bit more complicated.)
The Lertap Data worksheet turned out to have 93 columns for item responses. Why 93 when there were only 80 items in the pool? Because a few items allowed for multiple responses (see second tidbit below).
In this example, blanks were used as the did-not-see code. Were you to look at the item responses for any student, scanning from left to right over the 93 columns allocated, you'd see actual responses, many blanks, and, for those items not seen by a student but not answered, a 9.
We could, and will, entertain a variety of Lertap scoring "methods" which will demonstrate how the did-not-see options affect test scores.
To begin, say we have the did-not-see option off, that is, we have "no" in the System worksheet row which says "Use a did-not-see code?". Also, assume we have the PER control word on the *sub card.
The Scores output will look as follows:
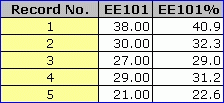
The first student had a test score of 38. Lertap says that the corresponding percentage score is 40.9, a value found by dividing the score, 38, by 93, the maximum possible test score if each item is scored giving one point for a correct answer.
But this is not correct in this case; no student had the opportunity to answer 93 items -- Test Pilot gave each student a random sample of approximately 40 items.
So, we activate the did-not-see option by putting "yes" in the second column of the System worksheet row which says "Use a did-not-see code?". We have "no" in the "Create an adjusted percentage score?" row. And, we still have PER on the *sub card. Our Scores now look as follows:
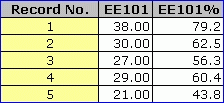
See how the percentage scores have changed? Lertap is now basing its percentage score on the maximum possible score which could have been earned on the actual items presented to the student. For the first student, the maximum was 48.
Dividing 38 by 48 and multiplying by 100 gives the 79.2 seen as the EE101% score for the first student.
Now, for the second student, does 30 divided by 48 equal 62.5? Yes. The problem is that the second student was presented with 40 items, not 48. The percentage score is wrong.
Whenever students are presented with a different number of items, or whenever items in the pool have different scoring patterns, "yes" should be used in the "Create an adjusted percentage score?" row.
So, let's see what happens. We put in that "yes". Do we still have PER on the *sub card? No, now it's not needed -- there would be no harm in having it there, but it is not required. Here are the scores:
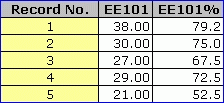
The percentage scores above have each been adjusted, according to the maximum possible score a student could have obtained on the set of items s/he was presented with.
Yes, Miss? (A young woman in the fortieth row of the third balcony has her hand up.)
Why wouldn't I just use the adjusted percentage score option all of the time? Why not put that yes where it's supposed to be, and just leave it there for always?
A good question, thank you. The answer: Lertap pinches extra memory from the computer whenever it has to keep track of the maximum possible score each student could have achieved given the items presented. You save memory space, and also a tiny bit of processing time, by not adjusting the percentages. If you know that each student was presented with the same number of items, and all items were scored the same way, then say "no" to the "Create an adjusted percentage score?" option. Now you know, no?
Related tidbits:
Several learning management systems support the development and delivery of online cognitive and affective tests. Some, such as Angel Learning, can be made to randomly sample items from a database, presenting different students with different versions of a test, each with the same number of items. In classical test theory, when certain conditions have been met, these versions might be termed parallel forms, or equivalent forms. However, as of March 2006, the data file of item responses created by Angel does not indicate which test "form" a student took. Fortunately, the Angel output is padded with did-not-see codes so that each data record has the same length, a length equal to the total number of items in the database.
In the Test Pilot example discussed above, the test included a few items which used a "Check all of the following options which would be correct" format, effectively turning a single item into multiple true-false items. Test Pilot actually served up the same number of items to each student (40), but those items which used the "check all of the following" format did not consistently offer the same number of options. The practical end result was as described above: students received a variable number of test items.
Did-not-see data will affect the calculation of alpha, Lertap's reliability coefficient -- alpha is NOT corrected for did-not-see cases.