Stats1b plots (affective items)

Contents
A plot of item correlations will be found at the bottom of every Stats-b report for affective items.
The screen shot below relates to the 10 items in the CEQ survey.
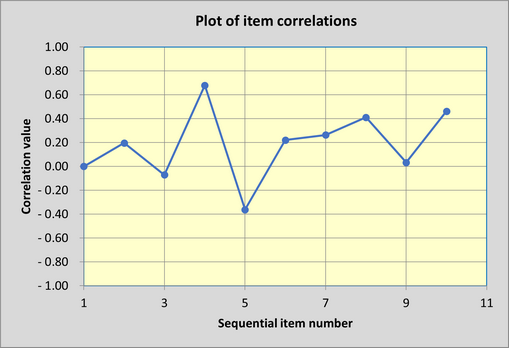
Each blue "blip" corresponds to the "cor." value for an item, where "cor." is an abbreviation for "correlation".
The correlation for the first item, Q1, was 0.00, as shown in the items stats table below. Q5 had the lowest correlation (-0.36).
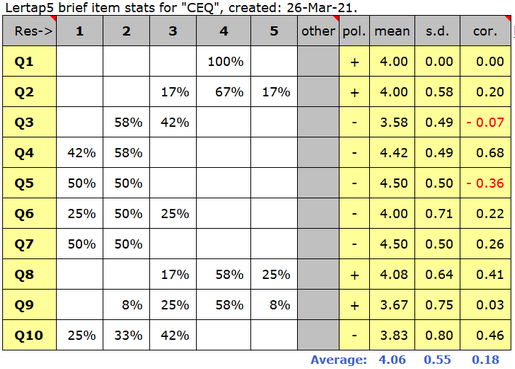
The authors of the CEQ questionnaire never intended for a total score to be made by summing question responses. Of course, Lertap doesn't know this -- it'll go on, pretending that a total score was of interest, and will report scale reliability by computing and displaying the coefficient alpha reliability estimate. It came out to be 0.448. This is low, too low -- these 10 items don't "hang together"; there would be no justification for forming a total score. Of course this is not to say that the survey results were of no value - they certainly were - but the information gathered by the CEQ survey would be interpreted solely on an item by item basis, not a total score.
Here's another example: the plot below is from the seven "technology" items in the DunnSES scale mentioned in this study.
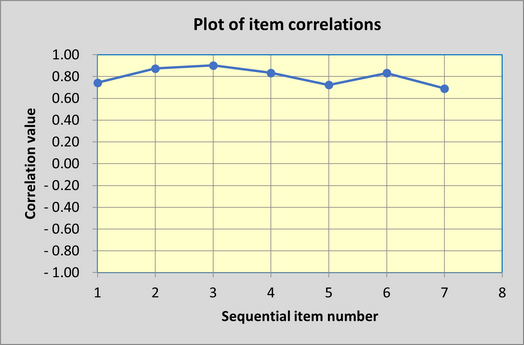
The DunnSES item correlations all tended to be high. No correlation was less than 0.60; there were no negative correlations.
The value of alpha in this case was 0.936 - there would be support for forming and using a total score from these seven items.
The use of plots such as those shown above, and their utility in reflecting an instrument's reliability, as measured by coefficient alpha, is further exemplified in this document under the "Reliability" heading (pages 8 to 11).