Rasch analysis

Contents
Lertap5 employs JML, joint maximum likelihood estimation, to derive Rasch estimates of item difficulty and student ability.
A comprehensive example exemplifies how JML works by using an Excel workbook. See Wu et al (p.123) for a description of JML in the context of Rasch scaling.
Note: There is another way to undertake a Rasch analysis with Lertap5. Pay a visit to the topic having to do with the "IRT with TAM" package, and the Omega1 special macro. An example of a report made by using TAM is here.
Tests must involve cognitive items scored on a right/wrong basis. That is to say, the program is exclusively for use with "dichotomous" test items.
Examples of the program's output are shown below. They're based on test results collected from students in Japan as part of the FIMS project.
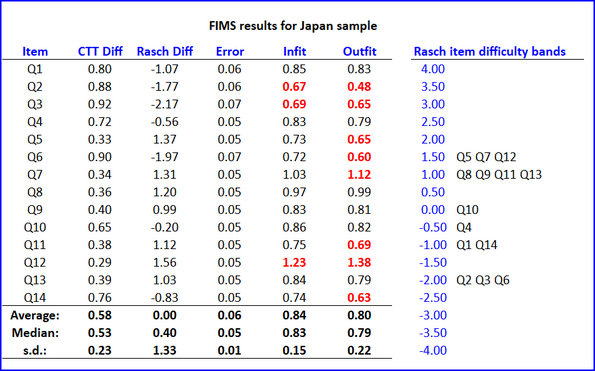
Note that the program has centered the item difficulty estimates, "Rasch Diff", at zero (the average difficulty is 0.00 as shown above). This is in keeping with the Rasch examples used in the Bond & Fox texts: "Applying the Rasch Model" (references are here).
Red highlighting is used to draw attention to item INFIT and OUTFIT values which may be less than or greater than desired.
values less than 0.7 will be in red no matter what the sample size (number of students)
values greater than 1.1 will be in red when sample size is 1000 and above
values greater than 1.2 will be in red when sample size is between 500 and 1000
values greater than 1.3 will be in red when there are less than 500 students
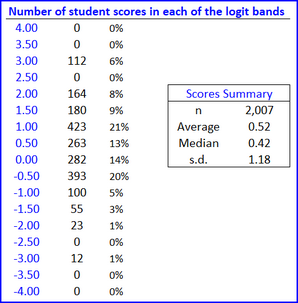
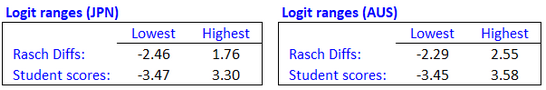
Another small section of the output is shown below. (The tables have come from two distinct workbooks in this example. The JPN results in the table below are not from the same JPN sample used above.)
When all iterations have been completed, the student (person) INFIT and OUTFIT values produced by the program will be found, along with Rasch scores, in the Scores worksheet. When these values are less than 0.75, or greater than 1.3, they are highlighted in red (no matter what the sample size might be). The Sort option may be used to have a closer look at the range of these values and scores.
Some of the examples in Bond & Fox are based on the "BLOT" test. The next page compares the program's output with that published on p.56 of Bond & Fox (2007).