Item responses by groups, "Ibreaks"

Contents
"Ibreaks" refers to the process of creating a report or two which summarizes the way groups have responded to test items.
Ibreaks requires two things: a column in the Data worksheet which identifies groups, and a Scores worksheet which it can interrogate as needed. (Scores worksheets are created by the Elmillon option, while Data worksheets are created by you -- click here if you need to be reminded about Data worksheets and their proper format.)
Caveat: The codes used to identify groups must begin with a letter. If, for example, gender has been coded as 1 or 2, Lertap5's recoder should be used to create a new column with new gender codes of, for example, F and M.

In the sample above, a group code, "Type", is seen in column 2. In this case, a "1" was used to denote workshop participants who were from private schools, with "2" used to code participants from public schools.
These codes are not optimal. As mentioned in the caveat above, they should start with a letter. The data recoder may be used to quickly change the codes. The screen snapshot below shows recoded Type values in column 41:
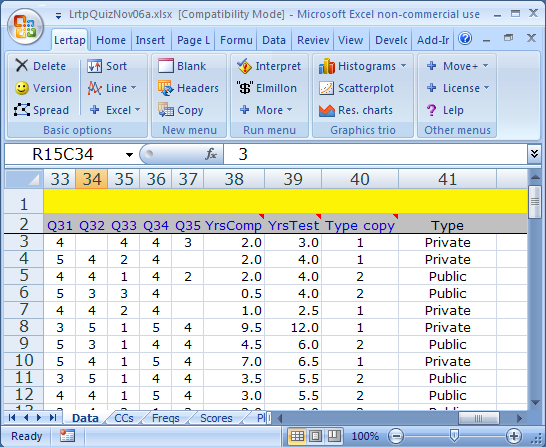
In this example, an original Type code of "1" has been recoded as "Private". The new code can be anything, as long as it begins with a letter. The new codes may have any length, but short codes result in Ibreaks tables and charts which tend to look a bit better. What's 'short'? -- say 8 characters or less.
Note: the recoder, also known as the "Recode macro", is available via the Move+ Menu. It is also possible to exclude certain cases from Ibreaks, such as, for example, cases with missing data. Click here to read more.
What might happen if group codes are numeric? The sky will fall; your bicycle tires will go flat. A more substantial outcome: the charts made by Excel will be wonky (incorrect).
Okay then, all's in order for an Ibreaks run. Ready to answer a batch of questions? Ibreaks will present several as it strives to do what you require. We'll be looking at an example of a cognitive test with 40 multiple-choice items scored on a right/wrong basis. A long-used test presented for years in a country's native language was translated to English. One group of high-school students sat the traditional native-language version of the test, while another group sat the English-language version. The two test forms were judged to be equivalent, differing only in the language used.
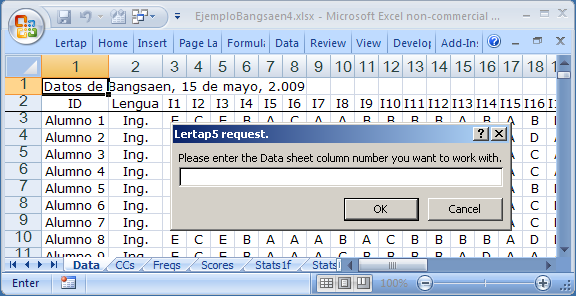
The first question Ibreaks asks concerns the location of the column with the group code. In this example, groups are coded by "Lengua" (tongue, or language) in column 2. A code of "Ing." means English, while a code of "Nat." means native.
In this case, the answer to the question posed is 2 (enter 2, then press the <Enter> or <Return> key on the keyboard).
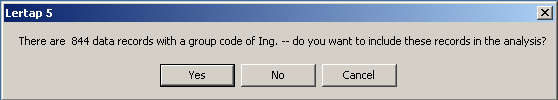
Ibreaks will step through all the distinct codes found in the Lengua column, presenting a question such as this one each time it encounters a new group code. In this example there are only two group codes, but often there will be more. Groups are included or excluded from the analysis according to the answer you give each time this questions appears.
At this point, a click on the Yes button will make sure that the responses of the Ing. group are included in the analysis. Ibreaks then presents the same question, this time for the Nat. group. Another click on the Yes button, and Ibreaks moves along to its next question.
If the Scores worksheet contains more than one score, the "next question" is one which asks you to pick out the score you want to work with. The score you select may be from either a cognitive or an affective subtest.
Next:
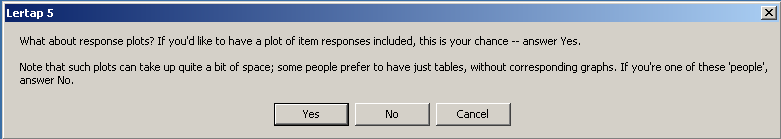
Over the years, and versions, Excel has at times placed a limit on the number of charts (or plots) which it will allow to be held in computer memory at any given time. This would be one possible reason to answer No to this question, but in this example a Yes answer is most appropriate so that you can see what the group response charts look like.
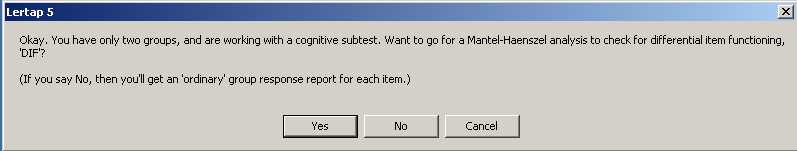
Here the answer will be No for the moment. This matter of "DIF" opens up a whole new topic, one which will be covered later.
Once you've answered its questions, Ibreaks gets down to work. It'll make a table of results for each item, and a response chart too, if you asked for charts.
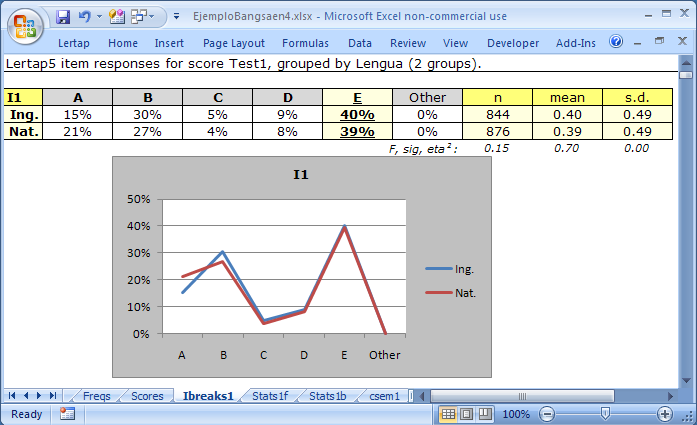
The correct answer to item I1 was E. Ibreaks denotes the correct answer by underlining, and by different shading.
The table and the graph both indicate that the two groups had rather similar response patterns for this item, especially when it came to the correct answer.
The short row of statistics below the table provides quantitative measures of how dissimilar the groups were in their response to the correct option. Ibreaks gets Lertap to undertake an analysis of variance, resulting in an F ratio to provide a test of the null hypothesis: "The means of the two populations of test takers who have been represented by the Ing. and Nat. samples of this data set are equal". The statistical significance of F is given by "sig".
In this case, F is 0.15, and sig. is 0.70. Not statistically significant: we usually want sig. to be .05 or less if we're interested in the null hypothesis and statistical significance.
Any analysis of variance worth its salt will provide an index of practical significance as well as F and sig. Lertap uses the correlation ratio for this, referred to as "eta2". It is thought, by some, that an eta2 value of .10 or more may be interpreted as indicating that the difference in sample means is practically significant, possibly pointing to a difference we might refer to as "important", or "meaningful". (For more comments on these statistics, and on the matter of "significance", see the 'Analysis of variance table' discussion at the end of the Breakouts topic.)
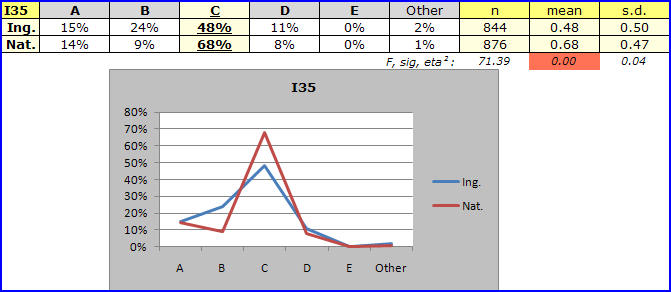
On this item, I35, 68% of the students in the Nat. group apparently knew the correct answer, compared to 48% in the Ing. group. The sig. value of F ratio is so small that, when rounded, it shows as 0.00 . The difference in item I35 means for the two groups is statistically significant. Eta2, at 0.04, fails to reach great heights -- if we applied standard guidelines for measures of practical significance, we'd conclude that the difference in means is not what many would term "meaningful".
But here we would be almost foolish to think that there's no real difference. Analysis of variance methods are based, not surprisingly, on partitioning score variances. With cognitive items scored on a right / wrong basis, there may well not be much score variance to partition. There is a difference between the groups on their answers to I35; even "Blind Freddy" would be likely to see it. And it's a meaningful difference, too. An advantage of 20 "points" on an item difficulty scale is substantial.
It could be that the Nat. students are more capable, full stop. If so, the response differences seen in our little I35 plot might not surprise us at all. However, this wasn't the case. There was solid evidence to suggest that the Nat. and Ing. groups may have been equally proficient on the subject matter covered by the test. The stage is set, then, for a "DIF" analysis, differential item functioning. Jump to the DIF topic now, if you'd like to.
Colouring. The sig. value for I35 of 0.00 has been shaded above. Lertap's Ibreaks routine is trained to colour sig. values, and also eta2 values, whenever they equal or fall below a cutoff minimum set in Lertap's System worksheet. Refer to the System settings topic, if you please.