Getting started

Contents
(Be sure to also visit the "What is Lertap topic" for getting-started suggestions.)
It's a fairly simple matter to get started with Lertap. Let us get you launched on the so-called "Cook's tour", and you can see for yourself.
When you start Lertap5 using Excel for Windows, or Excel for the Macintosh, your computer screen should bear quite a resemblance to the screen snapshot show below: (If it doesn't, refer back to HowToRunIt, and MacroSecurity.)
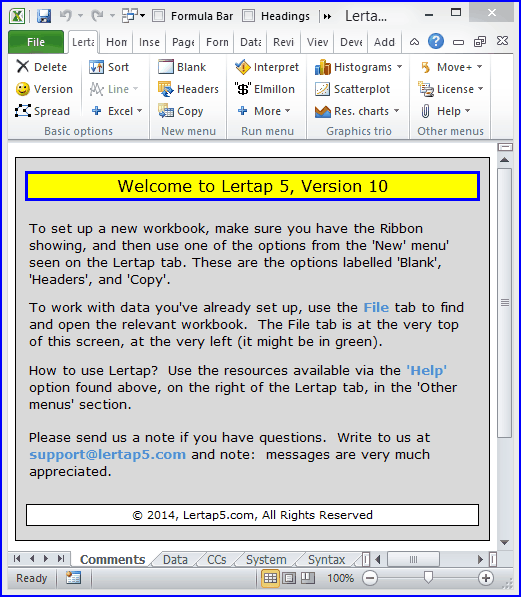
An important component of the screen seen above is the line of worksheet tabs showing towards the bottom of the screen. There are several tabs: Comments, Data, CCs, System, Syntax, and OldCCs.
Each tab corresponds to an Excel worksheet. The Data worksheet has the responses of 60 people to two quizzes. The CCs worksheet has a series of lines with Lertap's control syntax. Each of the syntax lines gives Excel information on how to process the data found in the Data worksheet. The Syntax worksheet is a quick reminder for experienced Lertappers on the correct format for CCs lines. The System worksheet turns on/off assorted Lertap options.
Go ahead and look at each of the worksheets if you'd like. Then come back here.
Okay? The Cook's tour starts with the Copy option on the New menu. This is your first task: find the New menu; find its Copy option; click on the Copy option. Hint: see screen snapshot below.

The Copy option causes Lertap to do a couple of somersaults and back flips -- it makes a copy of the Data and CCs worksheets, and places them in a new Excel workbook. When it finishes this task, Lertap says something like this:
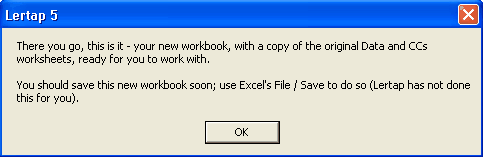
Don't worry about saving the new workbook for the moment. Click the OK button.
Your next move will be to click on the Interpret option on the Run menu.

This gets Lertap to read the lines in the CCs worksheet, checking to make sure they have the right syntax. If they do, Lertap creates some new worksheets, and displays one of them: "Freqs".
The Freqs worksheet is a simple one. It displays what are called "response frequencies" for each of the columns in the Data worksheet.
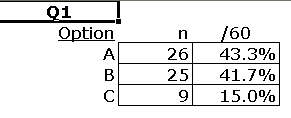
The little boxes above indicate that 26 people answered "A" on Q1.
The main purpose of the Freqs worksheet is to see if there may have been any errors in the preparation of the data. Users generally scroll down the Freqs worksheet rather quickly, looking for unexpected results. For example, a response of "D" on Q1 would be strange as Q1 allowed for just three responses: A, B, C.
To continue the tour, return to the Run menu now, and click on the Elmillon option. This causes Lertap to do quite a number of things -- for example, it creates test scores, putting them in a new worksheet called, appropriately, Scores. It also creates a variety of statistical reports, giving these names such as Stats1f, Stats1b, Stats1ul, Stats2f, and Stats2b. The partial screen snapshot below shows what the worksheet tabs will look like after this step:
![]()
The various "Stats" worksheets are usually why people run Lertap -- they give item and test statistics. Stats1f provides a complete, or "full", item and test analysis report for the first quiz, or test, giving quite detailed information for each test item, and presenting several mini-reports with overall test statistics. Branch out to the Stats1f topic for much more information.
The Stats1b report is a briefer summary of the item statistics found in Stats1f; it's easier to read. Branch out to the Stats1b topic.
If the test being analyzed is a cognitive test, Lertap generally produces a third report, Stats1ul; the "ul" means upper-lower, referring to a method of item analysis preferred by some. Branch out to the Stats1ul topic.
Lertap produces more reports than many people want. For example, the "b" Stats sheets, such as Stats1b and Stats2b, are redundant in that their information is also to be found in the respective "f" sheets, such as Stats1f and Stats2f. Some users make little use of the "b" sheets, preferring to drink their cup of tea with the "f" sheets. On the other hand, some Lertap users find there to be too much information in the "f" sheets; their needs are met by the "b" sheets, where they find that just half a cup of tea, a "brief" cup, is all that's needed to peruse the output. (It's possible to get Lertap to reduce the number of reports it gives. This is done by setting options in rows 9 and 10 of the System worksheet.)
Why are the "f" sheets made so that their initial focus is well down the worksheet? Stats1b and Stats1ul, for example, display their top rows at the top of the screen, but Stats1f and Stats2f do not display their upper-most rows at first. Why? Because experience has shown that the majority of users scroll to the reliability section of the "f" sheets before they look at anything else. A similar effect is seen in the Scores worksheet, where Lertap places the initial focus well down the worksheet, where the summary statistics begin.
For a thorough discussion of the statistics found in the Stats sheets, use the links above and/or click here to gain access to the manual.