Affective bands

Contents
These bands will appear when an affective scale has been used:
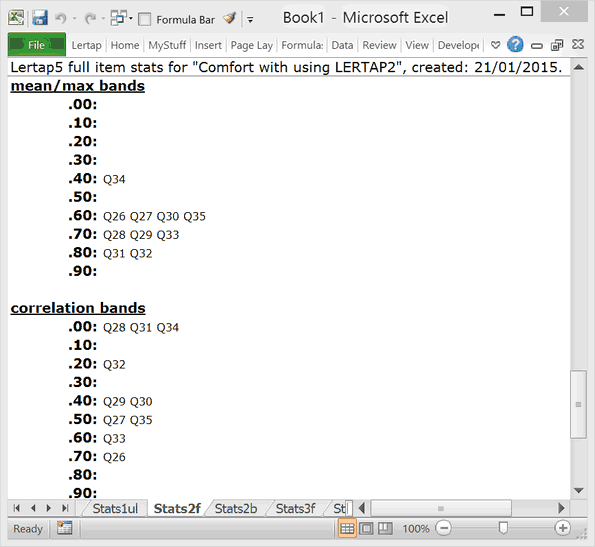
The "Mean/Max" figure is used as an indicator of how polarized an item's mean is. Q34 has the lowest mean/max figure above -- it was a five-option Likert question, going from 1 for strongly disagree to 5 for strongly agree. Its mean turned out to be 2.00. The maximum the mean could have been (had everyone selected 5) was 5.00. Dividing 2.00 by 5.00 gives the mean/max value of 0.40.
The correlation bands summarize the correlation between each item and the criterion score. The criterion score is most often simply the scale score (generally referred to as a "subtest score" in Lertap) but, at times, it may also be an "external criterion" score.
The bands, being just bands, are not too precise. The exact item mean and correlation values are found in the corresponding Stats-b summary (in the example above it would be Stats2b as the display is focused on a worksheet called Stats2f).