Lertap 5 documents series.
Using Lertap 5 in a Test Validity Study
Larry
R Nelson
Last updated: 10 June 2003.
(Click here to branch to www.larrynelsonstuff.com/lertap/)
This page was formerly published on the
Lertap 5 website at Curtin University of Technology. In 2014 it moved to
the website seen above. When you’d like to go there, the hyperlink above will
whisk you away.
A test is said to be valid if it measures what it purports to. There are a few different types of validity. Hopkins (1998), and Linn and Gronlund (1995), are good References. The type discussed here is concurrent validity.
In 2003, Ann Fletcher, a graduate student at Curtin University, developed a new instrument designed to assess a person’s “emotional intelligence”. She spent a lot of time piloting various versions of dozens of test items, looking to colleagues, as possible, for their comments on the perceived content validity of the developing items.
When it appeared the instrument’s items had stabilised, she thought she’d add to the new instrument’s portfolio by testing it for concurrent validity. To do this, she carefully selected a validation sample, and asked each person in the sample to respond first to the 60 items of her new test, and then, a day later, to the 52 items of a well-known published test, the “Bers”. (“Bers” is not the real name of the test, but will do for this discussion.)
Concurrent validity involves correlating the two test scores, in this case, the “Fletcher” and the “Bers”. There are several ways one could correlate the scores; to her great credit, Ann thought of using Lertap 5 to do the job.
The First Go
Ann’s first go with Lertap saw her creating two Lertap workbooks. A Lertap workbook is an Excel workbook which has two worksheets: one called “Data”, and another called “CCs”.
Into one workbook Ann put the Fletcher item responses. Into the other workbook went the Bers results. She had Lertap score the Bers test, using options on Lertap’s Run menu. In the process of scoring the Bers, Lertap added several new worksheets to the Bers workbook. These new worksheets constitute Lertap’s “output”.
One of these worksheets was called “Scores”; it contained two columns of information: a column with respondent ID codes, and a column with each respondent’s Bers score.
Another new worksheet created by Lertap was the one with full test statistics, “Stats1f”. A check of this worksheet showed the reliability of the Bers in the validity sample to be 0.97, as indexed by coefficient alpha.
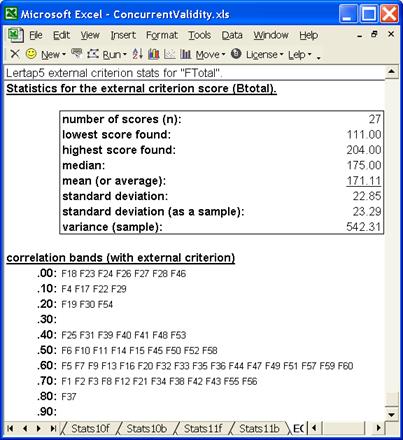
The texts referenced above point out that it is important for the criterion measure used in concurrent validity studies to have good reliability, and to demonstrate a fair range of scores. We certainly could not fault a reliability of 0.97. As to the score range, Lertap produced the following histogram of Bers scores:
The Bers total score, Btotal, ranged from a low of 111 to a maximum of 204, having a standard deviation of 22.85. (In the histogram above, the low score appears to be 112 – however, the histogram routine has collapsed the score intervals – 112 is really the centre of an interval which includes 111.)
The Btotal scores evidence negative skewing, and they tended to be high, wanting to touch the Bers ceiling of 208 – the maximum possible score on the instrument. The minimum observed Bers score of 111 was far removed from the instrument’s floor of 52. Nonetheless, it was felt these results were adequate.
Ann’s next step was to copy the two columns from the Bers workbook’s Scores worksheet, and paste them into the first empty columns in the Fletcher workbook’s Data worksheet. She knew she had to do this as the Bers score was going to be correlated with that from her own instrument.
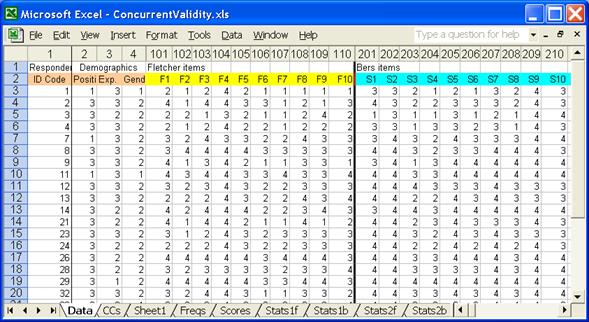
At this stage, the Data worksheet in the Fletcher workbook looked like this:
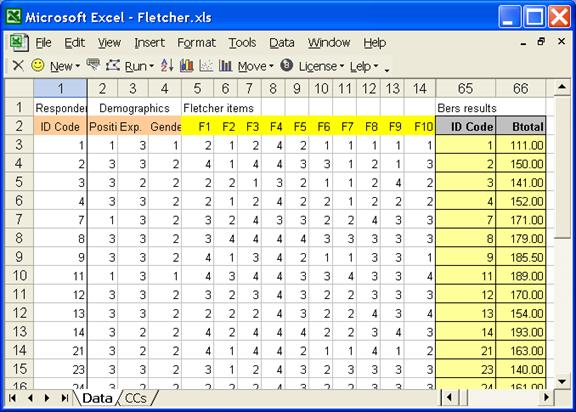
We’ve hidden columns 15 – 64 of the Data worksheet in order to be able to display the two pasted columns, as brought in from the Bers workbook’s Scores worksheet. These show as columns 65 and 66 above.
You have to be careful, in this sort of caper, to make sure the “imported” data, the two Bers columns, match up, ID-wise, with the Fletcher respondents. And they do. There is a match: compare column 1 above with column 65. Both of these columns contain respondent IDs, and they match, row per row.
In the CCs worksheet, Ann had these lines:
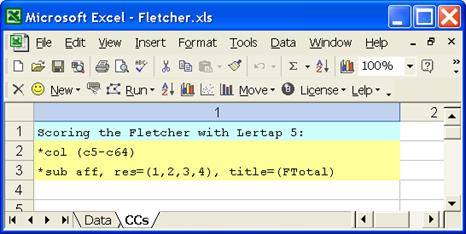
These lines tell Lertap that there are item responses in columns 5 through 64 of the Data worksheet; that the items were affective in nature; that responses ranged from 1 through 4 on each item; and that a working title for Lertap to use in its reports was to be “FTotal”.
At this point, she put Lertap through its strides. She went to the Run menu, and took the option to “Interpret CCs lines”. Lertap produced a new worksheet called “Freqs”, and asked Ann to look at it before proceeding. The Freqs report succinctly summarises the responses found for each item. Any response other than a 1, 2, 3, or 4 would have signalled a data processing error, but a scan of the Freqs report showed all to be okay. Ann returned to the Run menu, and clicked on “Elmillon item analysis”.
Lertap again created fresh output, new worksheets, ones named Scores, Stats1f, and Stats1b.
The Stats1f worksheet, the report with full item statistics, returned a coefficient alpha for the Fletcher of 0.97, identical to that found for the Bers. Ann used the histogram icon on Lertap’s toolbar to get the graph of FTotal scores shown below:
The FTotal scores had a distribution similar to Btotal, the Bers total score. They were negatively skewed, and tended to push up to the Fletcher ceiling of 240; their standard deviation, found towards the bottom of the Scores worksheet, was 28.04.
Now, what Ann most wanted was the concurrent validity of the Fletcher with the Bers. She wanted to see the correlation of Btotal and FTotal.
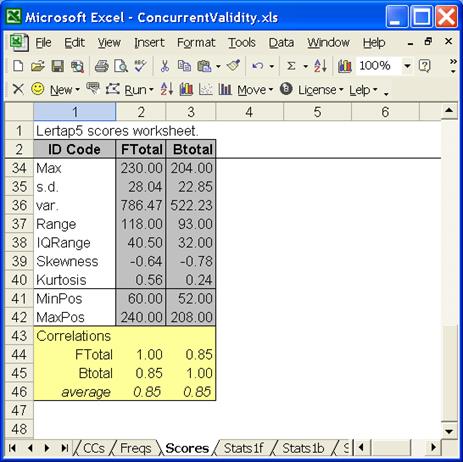
At this stage in the analysis it wasn’t available. Correlations among scores are found at the bottom of Lertap’s Scores worksheet, but to this point Lertap knows of only one score, the one created by scoring the item responses to the Fletcher. The lower end of the Scores worksheet looked like this:
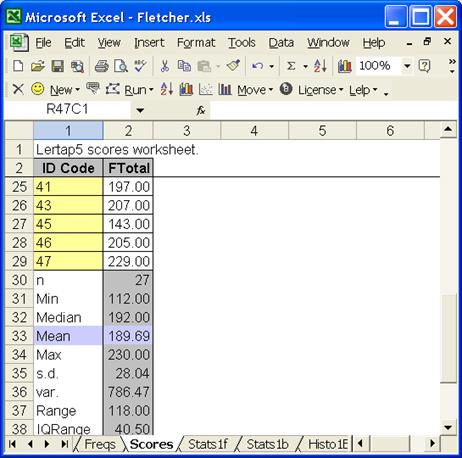
Where’s the column of Btotal scores?
It’s still back in column 66 of the Data worksheet. To bring Btotal into the picture, Lertap’s Move menu has to be used – it’s up on the Lertap toolbar. Ann clicked on Move, and from the list of options which dropped down, she selected “Copy a Data column to the Scores sheet”.
Lertap asked which of the Data worksheet’s columns was to be copied; 66 was Ann’s answer. Once Lertap had this information, it was able to add Btotal to the Scores worksheet, and, in the process, it automatically created a small correlation matrix:
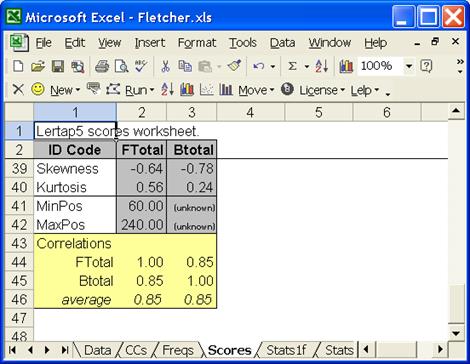
The concurrent validity of the Fletcher with the Bers is the correlation between the two measures, 0.85, a welcome figure.
“Dear Lertap, could you please plot the FTotal and Btotal scores in a scattergram.” But of course; one of the icons on Lertap’s toolbar makes scatterplots. Here’s what it looked like:
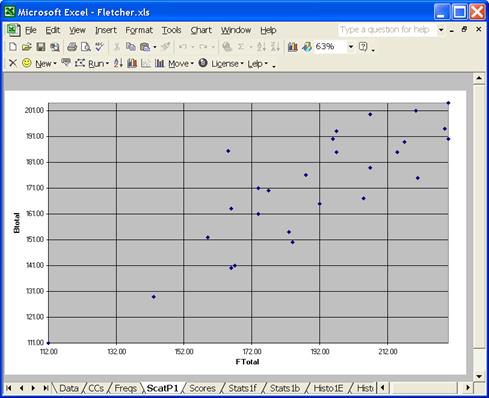
The scatterplot is quite reasonable. There is a clear pattern to the scores. Higher scores on FTotal generally correspond to higher scores on Btotal. There’s only one point which seems rather noticeably out of whack: someone got a score of about 185 on the Bers, while scoring about 165 on the Fletcher.
Here we could ask Excel to help out a bit. We’ll use the options available via Excel’s Chart menu to add a trend line to the graph, and we’ll turn on Excel’s Drawing toolbar to enable us to add an arrow highlighting the whacky point:
The point we’ve arrowed is obviously pretty far from the trend, but the overall pattern is still a satisfactory one, with little ambiguity.
Summary of
The First Go
The objective of this study was to establish the concurrent validity of a new, locally-developed instrument, the “Fletcher”. Concurrent validity involves correlating two test scores – the new test with an already-established measure. In this case, the latter measure was the “Bers”.
A sample of test takers was selected. Each person in the sample answered the 60 items of the Fletcher, and the 52 of the Bers.
Two Lertap workbooks were created, one for Fletcher, one for Bers. Item responses were entered in each workbook’s Data sheet; CCs lines were created, and Lertap’s Run menu was used, in the Bers workbook, to get scores and test statistics. It was found that the Bers instrument had excellent reliability in the sample, and seemed to have produced a workable spread of scores. The scores from the Bers were called Btotal.
The Btotal scores were copied from the Bers workbook’s Scores sheet, and pasted into the Fletcher workbook’s Data sheet as a new column. The ID codes from the Bers were also copied and pasted – this was done to make sure that the Bers results had been pasted into the correct rows.
Lertap’s Run menu was then used in the Fletcher workbook. It was found that the Fletcher instrument also had excellent reliability, and a fair distribution of scores. The scores from the Fletcher were called FTotal.
In order to correlate FTotal with Btotal, Lertap’s Move menu was used, in the Fletcher workbook, to copy Btotal from the Data sheet to the Scores sheet. The correlation was 0.85, quite okay. Lertap was asked to plot FTotal against Btotal, and the resultant scatterplot was fine, showing no real “outliers” (scores which would fall quite distant from a trend line, were one plotted).
Ann Fletcher was then able to add a handy credential to her new instrument’s profile. She was able to say that a concurrent validity coefficient of 0.85 was found when Fletcher test results were paired with results from a well-known instrument regarded as measuring the same thing.
A Better Go
There would have been an easier way to complete this study. Much easier. Instead of making two workbooks, one for one test, one for the other, all results could have gone into just one solitary workbook.
Please see the Data worksheet below:
We’ve put the item responses from both tests into one Data worksheet. Note the column numbers above. The Fletcher items were coded in columns 101 through 160, while the Bers items were in columns 201 through 252. (We have hidden many of the worksheet’s columns.)
Does it seem strange to have moved the Fletcher items way out to column 101? Weren’t they happy starting life in column 5, as in the previous example? Yes, they were – this is strange. We’ll reveal our motives later.
Here’s a CCs sheet suitable for analysing the data.
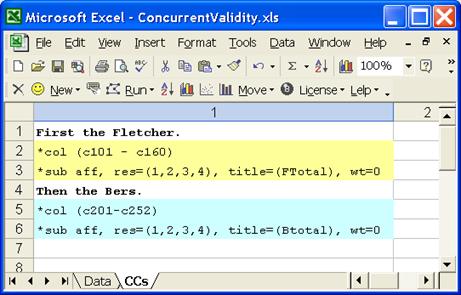
As seen above, we’re telling Lertap that our job involves two “subtests”, two groupings of items: one in columns 101 through 160, another in columns 201 through 252. The two wt=0 assignments are used to stop Lertap from adding our two “subtest” scores to make a total. Lertap has a penchant for adding things together; the wt=0 things tell it not to worry. (Nothing disastrous would have happened had we not used wt=0; we know we don’t really want the two scores to be added, and we just happen to remember that wt=0 can be used to turn off the adder.)
Now, up to the Run menu once (Interpret CCs lines), and then again (Elmillon item analysis). These actions cause Lertap to add new worksheets to the workbook. There will be a Freqs worksheet, a Scores worksheet, and two item analysis reports for each test (or “subtest”): Stats1f and Stats1b, plus Stats2f and Stats2b.
In theory, at this point, we look at the Stats1f and Stats2f reports to check on each test’s reliability, and we tickle Lertap into making histograms, just to ensure that our tests have produced adequate spreads of scores. In theory. Of course, in actuality we rush to open the Scores worksheet, and this is what we see:
We found our concurrent validity figure, 0.85, with much less hassle than before. The “trick” was to process both tests in one workbook.
The Whole
Truth
There was a bit more to this study. Each of the tests actually had several subtests. The Data worksheet corresponding to the real study was as shown above, with Fletcher and Bers items in one sheet, but the CCs worksheet was considerably more complicated, witness:
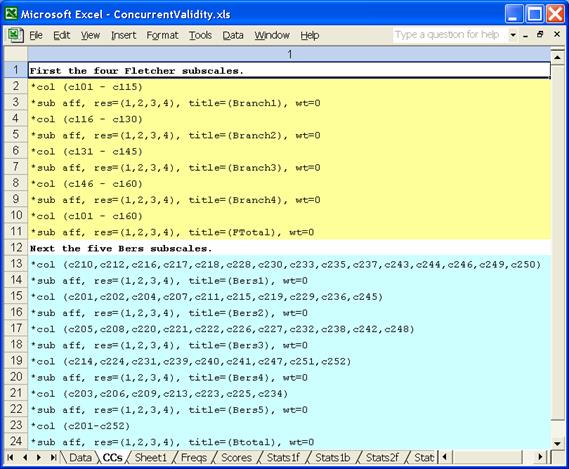
The Fletcher test had four subtests, called Branches. The Bers test had five subtests, which (for convenience) we’ve simple labelled Bers1 to Bers5.
The Scores sheet for this job looked like this:
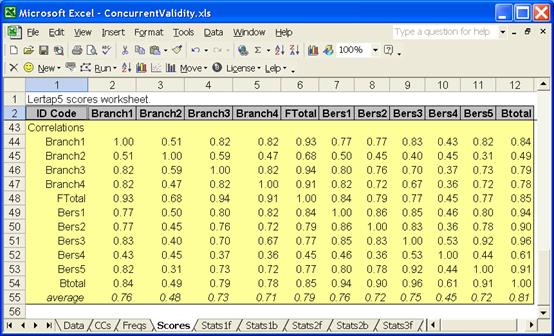
Now, to wrap up, we can say why we moved the item responses so that Fletcher started in column 101, and Bers in 201. Doing this made it a lot easier to create the various *col CCs lines required to form the subtests, especially for the Bers scale. For example, the first Bers subtest, Bers1, consisted of items 10, 12, 16, 17, 18, 28, 30, and so on. The subtest’s items were not in contiguous columns. In these cases many people would make a codebook to keep track of things, to make it easier to remember which item belongs to which subtest, and which Data column item responses are found in. An example of a codebook can be found towards the end of Chapter 4 of the Lertap manual (Nelson, 2000).
Codebooks are fine tools, but we prefer to work without them, whenever possible. Placing the Bers items so that they started in column 201 meant that our *col lines were simply the actual item numbers, plus 200:
*col
(c210, c212, c216-c218, c228, c230 ….)
The Full
Monty – an External Criterion
No doubt you are impressed with the goings-on to this spot, but wait: there’s more. We could ask Lertap to use the total score from the Bers test, Btotal, as an external criterion, and correlate each of the Fletcher items with it.
Ready?
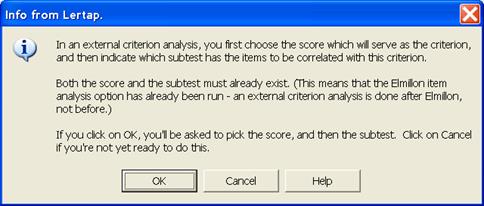
We let our mouse cruise up to Lertap’s Run menu, and selected “External criterion analysis”. Lertap provided the following announcement:
Btotal will be the “score which will serve as the criterion”, and the subtest with the items to be correlated has a title of FTotal.
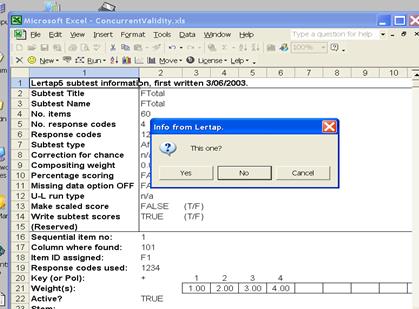
Btotal is in column 12 of the Scores worksheet, as pictured above. We told Lertap this when asked, after which Lertap began to cycle through the Sub worksheets corresponding to each subtest (these worksheets are ordinarily hidden from view – you don’t need to, but you can read about them in the Lertap manual (Nelson, 2000), or in the online help files available from the Lertap website).
Lertap flashed up the Sub sheets corresponding to each of the Fletcher subtests, starting with Branch1. When it got to FTotal, as shown below, we clicked on the Yes button:
Lertap went off and did its magic, producing an external criterion report, placing it in a new worksheet called “ECStats5f”. There is some sense to the naming of this report: EC means external criterion; the “5” refers to the 5th subtest, which was FTotal in this study; and the “f” means “full statistics”. (When the name of a Lertap worksheet ends in “b”, the report seen in the worksheet is a “brief” one, containing only some of the information found in the corresponding “f” worksheet.)
In the ECStats5f report, each item is correlated with the external criterion. For example, the correlation between item F1, the first Fletcher item, and the external criterion, was 0.72, as shown next to r/ec in the snapshot below.
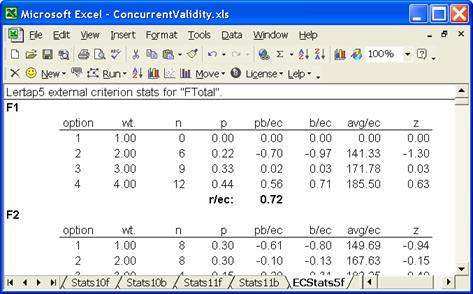
It is interesting to look down the avg/ec column in this report. It shows the average external criterion score for the people choosing each of item F1’s options, and a pattern is obvious: as people choose higher F1 options, the average criterion score increases. The correlation of 0.72 concisely summarises this.
Now, look at item F28 – its correlation with the external criterion (Btotal), is negative, and there is not a clear pattern in the avg/ec column:
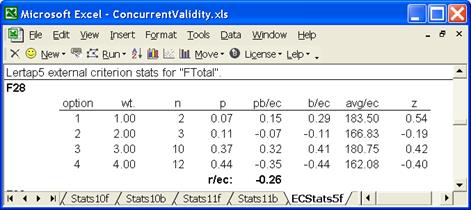
The end of ECStats5f report is generally quite useful as it provides a succinct summary of the correlations. It’s captured below:
The seven items on the .00 line, F18, F23, …, F46, have low correlations with Btotal. In fact, some of these correlations are negative – we have just seen, for example, that F28 has a correlation of -0.26.
These seven items, combined with the four in the next row, .10, indicate that 11 of the 60 Fletcher were “weak” when it came to matching them against the criterion measure. This doesn’t mean the items were bad, just that the answers people gave to them bore little relationship to their Btotal score.
But it’s also true that items such as these served to bring down the concurrent validity of the Fletcher instrument. It was found to be 0.85, a good result – but it would likely have been higher had the “weak” Fletcher items been weeded out. Having said this, though, it is also true that researchers are sometimes loath to toss out the weak items. This will happen when it’s felt the items are contributing useful information, even though they may not correlate well with the criterion measure. Perhaps the instrument could be used for two purposes; we could shorten it by taking out the weak items, and say we have an alternative to the Bers test. We could then use its longer form, the 60-item form, when we’re perhaps more interested in looking at individual item results instead of the total Fletcher test score.
Write is
Right!
This study exemplifies more advanced applications of Lertap 5. If you get into similar work, and aren’t quite sure how to proceed, why not write us a note? We can be reached via email at support@lertap5.com.
References
The references
cited in the comments above are to be found on the Lertap website. If you’re connected to the Internet, click
here to bring up the References page.