Lertap 5 documents series.
Using Lertap 5 in a Parallel-Forms Reliability Study
Larry
R Nelson
Last updated: 16 July 2003.
(Click here
to branch to www.larrynelsonstuff.com/lertap/)
This page has been published on the
Lertap 5 website at Curtin University of Technology. When you’d like to go there, let the
hyperlink above be your transport.
A test is said to be reliable if its measures are accurate. There are numerous ways in which the reliability of a test may be indexed. Hopkins (1998), and Linn and Gronlund (1995), are good references.
Lertap 5’s common measure of test reliability is based on coefficient alpha, often called Cronbach’s alpha. Alpha belongs to the type of reliability measure known as “internal consistency”. It is, basically, an index of the extent to which the items comprising the test intercorrelate. If there are high correlations among test items, the value of coefficient alpha will be high. Only one administration of a test is required to determine alpha.
At times test developers will create two forms of the same test, and then assess test reliability by correlating the two forms. Under certain circumstances, the forms are said to be “parallel”, meaning that they may be used interchangeably. “Parallel forms” reliability is the correlation between test scores when both forms have been given to the same group of test takers.
Using Lertap 5 to assess the parallel forms reliability of a test is the focus of this document. Our data are from an English-speaking country in the Southern Hemisphere, a country whose Department / Ministry of Education wanted to develop its own scholastic aptitude test for use in high schools.
The data we’ll present are from one of the first norming samples, involving just under 300 scientifically-selected students. As we go about the process of determining parallel forms reliability, we’ll draw attention to some practical data processing matters, exemplifying how some of Lertap’s and Excel’s basic tools may be used to isolate errors, to assess the amount of missing data, and to indicate how much a test may have been speeded (a speeded test is one where, by design, not all students will find sufficient time to reach the end of the test).
The example we’ll be looking at here is one wherein multiple-choice and short-answer questions were mixed in both forms of the test.
The Forms
Both test forms, Form A and Form B, involved 70 items. Form A had 50 multiple-choice items, and 20 short-answer items. Form B had 49 multiple-choice items, and 21 short-answer items. The short-answer questions were mixed in with the multiple-choice questions; the forms begin with a multiple-choice question, switch to two short-answer questions, switch back to multiple-choice for a while, then back to a couple of short-answer questions, and so on.
All of the multiple-choice items involved five responses, with the response-code set being {1,2,3,4,5}. Only one response was scored as correct, with one point awarded. The short-answer items were hand-scored on a simple right/wrong basis, with one point for a correct answer. For some reason, responses to the short-answer items were coded as {6,7}, with 6 used when the answer was correct.
Unanswered questions were coded as {9}.
Initial
Processing
Data were entered into an Excel worksheet according to the format below.
|
Columns |
Info |
Description |
Coding |
|
1 |
Form 1st |
Indicates which form the student sat first. |
1 = Form A
first |
|
3 |
Gender |
|
1 = male 2 = female |
|
6 - 75 |
Form A |
Answers to the 70 Form A items. |
{1,2,3,4,5} for
MC |
|
76 - 145 |
Form B |
Answers to the 70 Form B items. |
{1,2,3,4,5} for
MC |
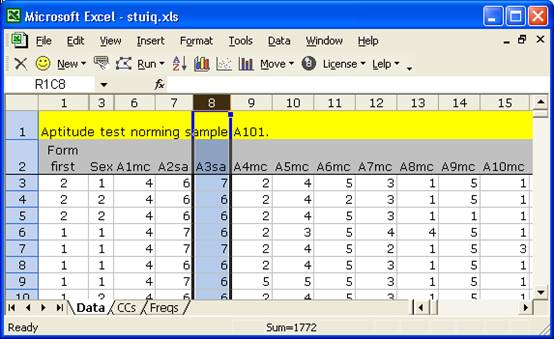
The first few rows of our Lertap Data worksheet looked like this:
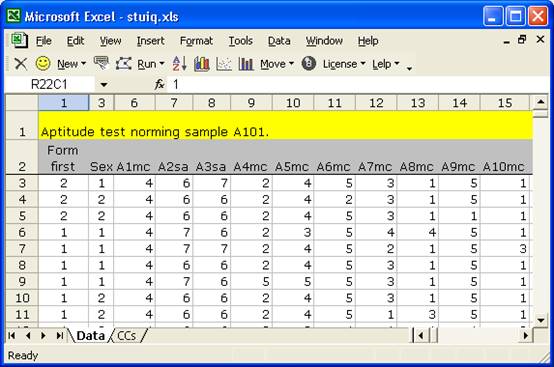
Note that the ID of the first item is “A1mc”, the second “A2sa”, and so on. The letter indicates the form, the digit the item number within the form, while the letters “mc” stand for multiple-choice, and “sa” short-answer. The item IDs could have been anything we wanted; we chose an ID scheme which would make it easy for us quickly recognise the item’s source and type.
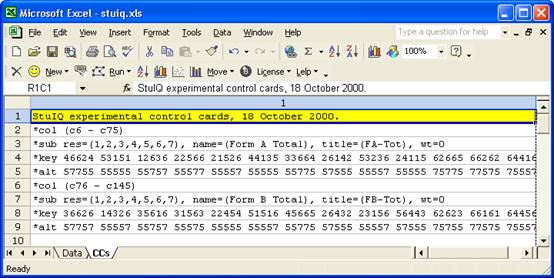
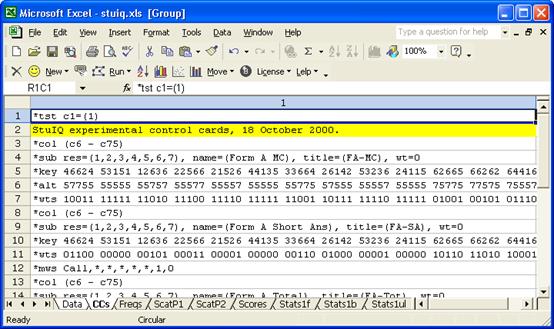
Our initial CCs worksheet had just two lines:
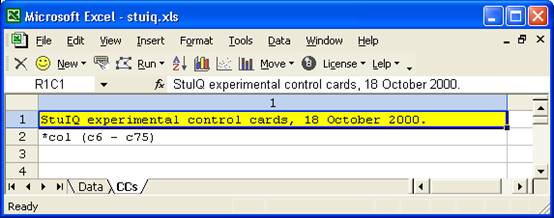
The CCs sheet has a comment line, followed by just one real CCs “card”, that is, a line beginning with an asterisk (*). A CCs worksheet such as this one will cause Lertap to create its summary of response frequencies only. Lertap’s “analysis” will be very short – all we’ll get is a Freqs report. At this point that’s all we wanted as we suspected the data had errors.
To get the Freqs report, we went to the Run menu options, and clicked on “Interpret CCs lines”. The top part of the report looked as follows:
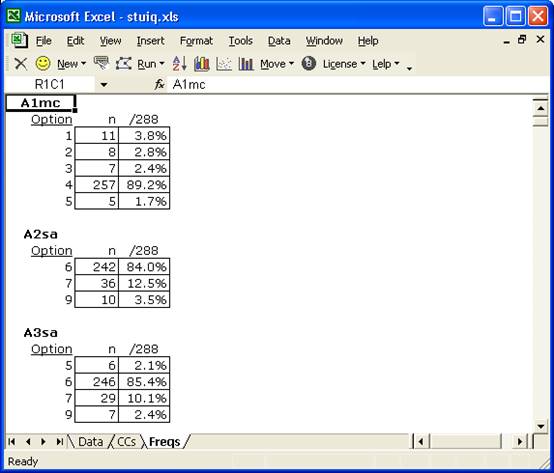
The response pattern for the first two items, A1mc and A2sa, is okay. Item A1mc was a multiple-choice question, and test takers made use of all the item’s response options. At this point we don’t know the correct answer to item A1mc, but it looks like it might be 4 as that is what almost everyone, 89.2%, selected.
Item A2sa was a short-answer item, and an easy one as 84.0% of the test takers got it right. The 9 indicates that 10 of the test takers, 3.5%, did not answer this question.
Now look at item A3sa. It’s a short-answer question, and it should not be possible for someone’s answer to be coded as 5. Why not? Because the only valid response codes for short-answer items are {6,7} and, for a non-response, {9}. The Freqs report is indicating a data processing error for item A3sa. In fact it’s saying there were 6 data entry mistakes for this question.
If you were able to examine the whole Freqs report, you’d come across numerous errors of this sort, and they were not limited to the short-answer items:
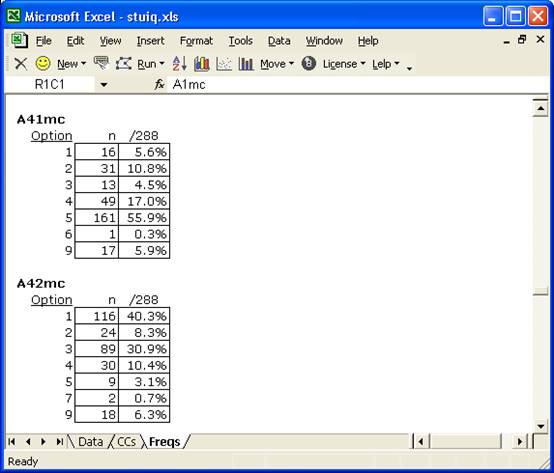
The screen shot above shows two more errors: response codes of 6 and 7 were not allowed for multiple-choice items. Altogether, 21 of the 70 Form A items had errors of this type. The errors are small – usually only 4 or 5 miscodes per item, but they’re frequent. Sloppy work.
Using
Excel’s Data Filter
Excel has an option which makes it a fairly easy task to find out which rows in the Data worksheet have the errors. If we could determine that the errors come from a very small number of data records, then maybe we could clean things up by just zapping the errant rows.
The first errors relate to item A3sa. We go to the Data worksheet, and select the column which corresponds to this item:
Then, we go to Data / Filter and select AutoFilter. This puts a little arrowhead in the first row:

We click on the arrowhead, and are given a list of all the characters found in the column:

The bad character is “5”; we click on it and Excel gives us a list of all the records (rows) which have a 5 in this column:
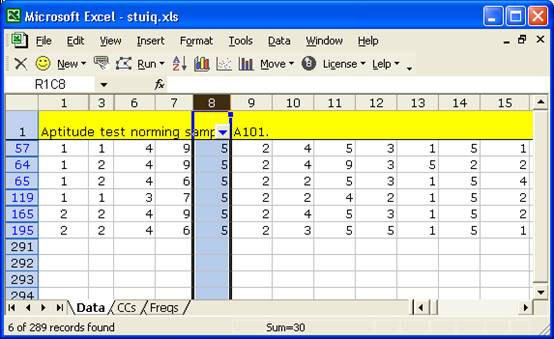
There are six rows in the Data worksheet, numbers 57, 64, 65, 119, 165, and 195, which have an error for item A3sa.
Do these rows have other errors? We went to the Data worksheet, and scrolled across each row. There wasn’t a pattern; there was only one other error. We applied the AutoFilter to other columns, and did not find a consistent pattern to the errors – they appeared to be random. If we had a choice, we would not use this data set without attempting to go back and validate the data processing, going through the records, one by one, fixing the errors. However, this choice was not available.
Looking for
a Speed Effect
This test was timed; a maximum of two hours was allowed for students to complete it. An allowance of 120 minutes to complete 70 items, with about 20 of them short-answer in nature, is not a great deal of time.
Did many students appear to fall short of attempting all of the items? Did they seem to run out of time? Was speed a factor?
We can get an initial idea by looking down the Freqs report, examining the frequency of 9s, which indicate non-answers.
Freqs indicates that the non-answer rate remains below 10% until we come to item A33sa, which returned a 45.5% non-answer percentage (131 of the 288 students did not answer this item). Then the non-answer rate drops back to about 6% until we get to item A45sa. From then on the prevalence of 9s is never below 10%; after item A52mc, it’s never less than 33%. Once we’re passed item A55mc, the non-answer rate remains above 50%, climbing to 70% and above as we reach A65sa.
It seems that there was definitely a speed factor.
Let’s get out Excel’s AutoFilter option again, and have it list all the records having a 9 in the column corresponding to item A52mc. This is what we see:
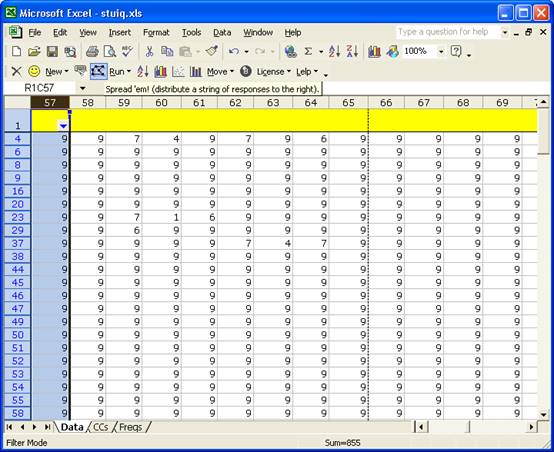
There’s a pattern above. Non-answers predominate; 95 of the 288 records had a 9 at the 52nd item, with most indicating non-answers to subsequent items.
Clearly there was not enough time for students to answer Form A. About 30% of the students failed to go beyond the 52nd question, leaving 18 items unanswered, about 25% of the 70-item test.
Speed played a part in Form A; an analysis of Form B revealed a similar effect.
It is not unusual for aptitude tests to be speeded. Some test developers obviously feel that a speed effect is not necessarily a bad effect; you might be inclined to agree if it can be demonstrated that a speeded test still has validity.
When it comes to assessing a speeded test’s reliability, Crocker and Algina (1986, p. 145) point out that an internal consistency estimate, such as coefficient alpha, is not appropriate as it “may be artificially inflated because of consistency in performance caused by the test’s time limit”, and go on to say “Thus it is probably most appropriate to use the test-retest or equivalent form method to estimate the reliability of a speeded test”. (What we call parallel forms Crocker and Algina call equivalent forms.)
Parallel
Forms Reliability
It is a relatively straightforward matter to get Lertap to compute the correlation between Form A and Form B test scores. The CCs lines shown below will do the job:
Each of the *key and *alt cards has a total of 70 entries, one for each test item (not all of them are shown). The first *key card above indicates that the right answer to the first item was 4; to the second it was 6; to the third it was 6; to the fourth it was 2; and so on.
The first *alt card above tells Lertap that the first item used the first 5 codes found in the Res= declaration; the second item used all 7 response codes, as did the third; the fourth item used just 5 of the response codes; and so forth.
Every time there is a 6 on the *key card, there should be a 7 on the *alt card – 6 was used to code the right answer for a short-answer question, and short-answer questions used {6,7} as their response codes.
This brings up an interesting question: Is it possible to make Lertap realise that response codes of {1,2,3,4,5} are not appropriate for the short-answer questions? As things stand above, we’re saying that the short answer questions used {1,2,3,4,5,6,7} as responses, but this is not true. Can we tell Lertap this?
Yes, use a *mws call line; an example is coming up below. For the moment, let’s get Lertap to find the correlation between Form A and Form B test scores.
How? Use the Run menu, and Interpret the CCs lines. Then use the Run menu again, this time clicking on the Elmillon item analysis option.
The correlation between the two forms, the parallel-forms reliability coefficient, is shown at the bottom of Lertap’s Scores report. It turned out to be high, 0.84, as shown below:
Parallel
Sub-Forms Reliability
Why not dig more? Let’s define more subtests. For Form A, we’ll have a Form Amc subtest, a Form Asa subtest, and then the complete Form A “subtest”. We’ll do the same for Form B, breaking the test into its multiple-choice and short-answer sections.
The CCs cards now get more complicated. Take a deep breath, and have a look:
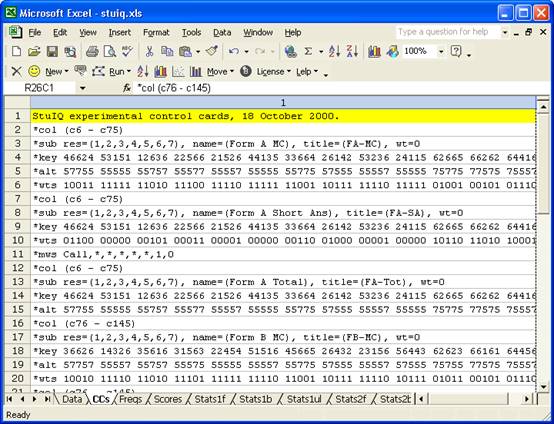
The CCs cards above will not be easy for Lertap tyros to understand.
We might begin by asking you to look at rows 13 – 15 above. You’ve seen these three lines before; we used them at the start of the last section. These three lines tell Lertap how to process all the items in Form A.
Now, look at rows 2 – 5. They’re the same as rows 13 – 15, except for changes to the name= and title= on the *sub card.
So far so good?
Now then: row 6, a *wts card, has fifty (50) 1s, and twenty (20) 0s. The 1s (ones) correspond to the multiple-choice items, while the 0s (zeroes) correspond to the short-answers. Compare with row 10. Where row 6 has a one, row 10 has a zero.
We’re using zeroes on *wts cards to remove items from their subtest. We want the first subtest to be the Form A multiple-choice items; we want the second subtest to be the short-answer items.
Why don’t we have a *wts card for the whole of Form A. That is, why isn’t there a *wts card after row 15? Because it’s not required. We don’t want to remove any items from the whole. If we had any *wts card at all, it would simply be a string of 70 1s, one for each item. But this is Lertap’s default action. It always gives an item a weight (or point value) of one unless we say otherwise.
Now, one more thing to look at. Row 11. What is that *mws call card doing?
It’s telling Lertap that the short-answer items only use response codes of {6,7}. The five asterisks tell Lertap that items do not make use of the first five codes found in the Res= declaration. The 1 (one) says give a point for every six (6) encountered, while the 0 (zero) says don’t give any point when a seven (7) is encountered.
There would have been other ways to write up this “job”; there would have been other ways to make the CCs lines. What we have done here evidences a mastery of CCs syntax, reflecting lots of experience, something you might expect from people who slave away here at Lertap Central.
Anyway, let’s now get all those correlations. We Interpret the CCs lines, and use Elmillon item analysis. We let Lertap do its thing, and, when it settles down, we look at the bottom of the Scores worksheet:
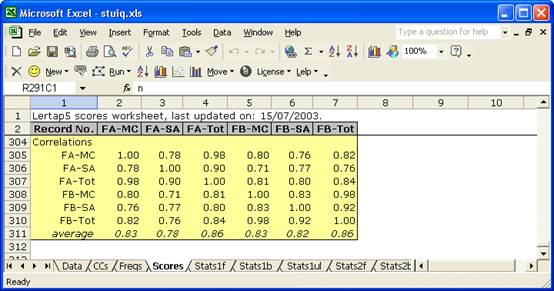
Once again we see 0.84 as the correlation between the two forms. And now we can get a big cuppa something, and browse the other correlations.
All the correlations are high. The parallel sub-forms figures are 0.80 for the two multiple-choice sub-forms, FA-MC with FB-MC, and 0.77 for the short-answer sub-forms, FA-SA with FB-SA.
FA-MC correlates a bit better with its FB counterpart, FB-MC, than it does with its own short-answer sub-form, FA-SA.
Some readers may want to discuss the correlations which get into the 0.90s, such as that between FA-MC and FA-Tot. These correlations could be called spurious; they’re artefacts of part-whole contamination; they are not meaningful. FA-MC is part of FA-Tot, for example; these are not independent scores.
Parallel
Forms Statistics
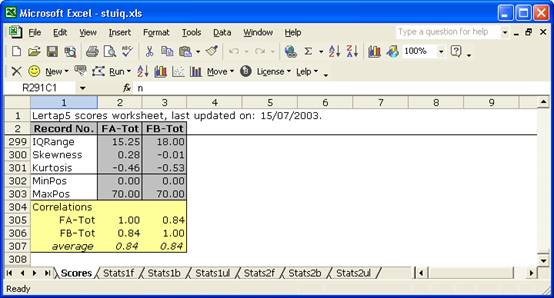
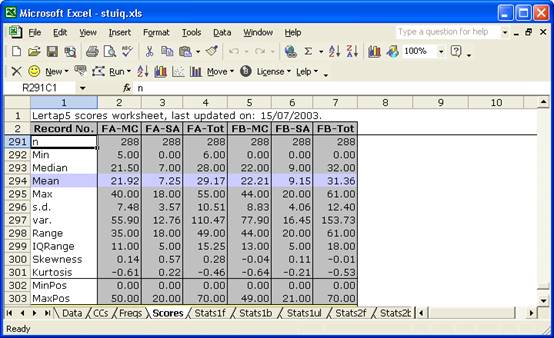
The Scores report also lets us compare basic form statistics:
And we can easily get histograms to compare:
Form B was a bit easier than Form A (compare the means), and Form B scores exhibited more variance.
The scatterplot of FA-Tot and FB-Tot is displayed here:
Uh-oh. There is a clear anomaly in the scatterplot. One student got a zero on Form B. (This may be a bit hard to see; the student’s Form A score was 24 – if you look very closely, you may make out a blip at the point FA-Tot=24, FB-Tot=0. The blip falls on the axis, making it hard to pick out.)
Who was this student? We can use an icon on Lertap’s toolbar to sort the scores, or we can just scroll down the Scores worksheet. There aren’t all that many scores in this case. Scrolling the Scores worksheet is fast, indicating that the 152nd record in the Data sheet is the one resulting in a FB-Tot of zero. And sure enough, it seems there was another data-processing error: this student’s Form B results are all 9s; he or she did not answer a single item on Form B. This student should not have been included in the data analysis. (We should wipe this student’s record from the Data worksheet, and do all of our analyses again.)
A Practice
Effect?
Did the students who sat Form A first have higher scores on Form B than those students who sat Form B first? And, did those students who sat Form B first have higher scores on Form A than those who sat Form A first? In other words, can we find evidence to suggest a practice, or coaching effect? Having sat one test, did this, perhaps, get students into the groove, making them better prepared for the second test? (Incidentally, we haven’t mentioned the time between test sittings. It was 20 hours.)
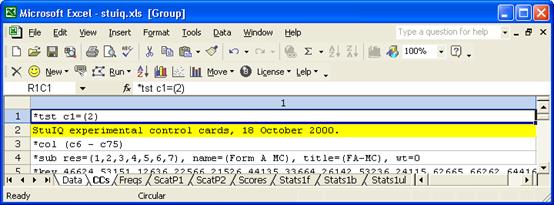
To find out, we’ll ask Lertap to make us a new data set, one with just those students who sat Form A first. The information we need to do this is in column 1 of the Data worksheet. Being ever so keen readers of the Lertap manual, and “Lelp”, the online help system, we know that a *tst card can be used to accomplish our objective. Here are our CCs lines:
The only change we made was to the last CCs worksheet was to insert a *tst line at the top of the sheet, as indicated above. We then ran “Interpret CCs lines”, and Lertap made a new workbook for us, one with only those Data records having a “1” in the first column. This we saved as FormAFirst.xls.
Then we changed the *tst card as follows:
We ran “Interpret CCs lines”, and saved the new workbook which resulted as FormBFirst.xls.
Within each of the new workbooks, we ran “Interpret CCs lines” and “Elmillon item analysis”. Then we copied and reformatted areas of the two Scores worksheets. Here are the results:
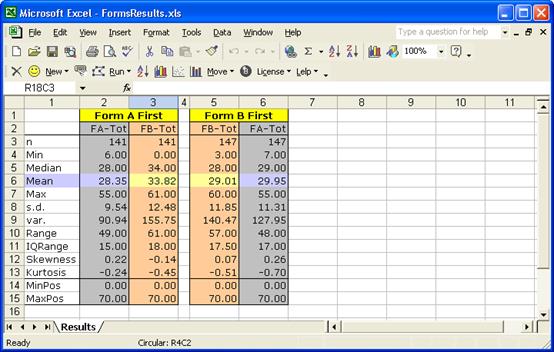
What do you think? The results seem to suggest that sitting Form A first was beneficial when it came time to sit Form B. Those who sat Form A first had an average Form B score of 33.82, more than four points above the Form B average of 29.01 for those who sat B first.
It’s interesting to note that sitting Form B first did not seem to provide as much of a boost – the average Form A score for those who did was 29.95, only a wee bit better than the average of 28.35 for those who initially sat Form A.
Please Write
This study exemplifies some more advanced applications of Lertap 5. If you get into similar work, and aren’t quite sure what to do, why not drop us a note? We can be reached via email at support@lertap5.com.
References
The references cited
in the comments above are to be found on the Lertap website. If you’re connected to the Internet, click
here to bring up the References page.